
How to Track Pitch Deck Views (I See Every Slide They Read) in 2026

Co-founder at Peony. Former VC at Backed VC and growth-equity investor at Target Global — I write about investors, fundraising, and deal advisors from the deal-side perspective I spent years in.
Set up my next data room with SeanLast updated: March 2026
You just sent your pitch deck to 30 investors. Now what? You wait. You check your inbox every hour. You wonder if they even opened it. Most founders live in this limbo for weeks — sending follow-ups into the void, guessing who is interested, and wasting time on investors who deleted the email without reading it.
I know this because I lived it. And it is the reason I built page-level analytics at Peony.
Here is the moment that changed how I think about fundraising: during our own raise, I shared the deck with a partner at a fund we were excited about. Two days passed with no response. I was about to write them off. Then I checked Peony's dashboard and saw something unexpected — they had opened the deck three separate times. On the third visit, they spent 8 minutes on the revenue model slide but skipped the team page entirely. That told me exactly what to prepare for the follow-up call: unit economics, not bios. When I got on the phone and led with our CAC payback period and LTV assumptions, the partner said, "You clearly know your numbers." We moved to the next stage that week. Without the analytics, I would have either given up or walked into the meeting blind.
That is what pitch deck tracking does. It turns silence into signal.
TL;DR: Most founders send pitch decks and hope for the best. Peony shows you exactly who viewed your deck, which slides they read, how long they spent on each page, and when they came back for a second look — so you can follow up at the right time with the right message. Free tier available, no credit card required. For the full analytics breakdown, start with Method 1.
Quick guide — pick your tracking method:
- Want slide-by-slide analytics with time tracking and revisit detection? Peony (free) — Method 1
- Already using DocSend? Basic page tracking, $30/user/mo — Method 2
- Hoping email read receipts work? They mostly do not — Method 3
- Shared via Google Drive? Minimal "who viewed" data — Method 4
- Considering PDF tracking pixels? Hacky and easily blocked — Method 5
- Prefer the direct approach? Just ask — Method 6
Why tracking pitch deck engagement matters
Investors will not tell you they are not interested. That is the uncomfortable truth of fundraising. The polite "let me discuss with my partners" often means "I'm passing but don't want to say it." The enthusiastic "love what you're building" sometimes means "I read three slides and moved on."
I have sent hundreds of deck links over the past two years. Here is what I learned about the gap between what investors say and what they do:
Without tracking (the blind send):
- You email a PDF attachment and lose all visibility the moment it leaves your outbox — see our guide on how to send your pitch deck to investors for better approaches
- You have no idea if the investor opened the email, downloaded the file, or read a single slide
- You follow up on a random schedule — too early (annoying) or too late (they have moved on)
- You spend equal time on investors who spent 8 minutes on your deck and investors who never opened it
- You walk into calls with no idea what interested them
With tracking (data-driven fundraising):
- You see the exact moment an investor opens your deck
- You know which slides they read, which they skipped, and which they came back to
- You follow up within hours of a high-engagement view — while your startup is fresh in their mind
- You prioritize investors showing genuine interest (repeat visits, financial slide engagement)
- You walk into calls knowing exactly what to address
The difference is not subtle. Founders who track engagement can focus their limited time on the investors most likely to write a check, personalize every conversation based on actual behavior, and avoid wasting weeks chasing people who were never going to respond.
6 methods to track pitch deck engagement
Method 1: Peony page-level analytics (the gold standard)
We built Peony's analytics specifically because the existing tools were not giving founders the signals they needed. Knowing that someone "opened" your deck is table stakes. What changes fundraising outcomes is knowing which slides they cared about and whether they came back.
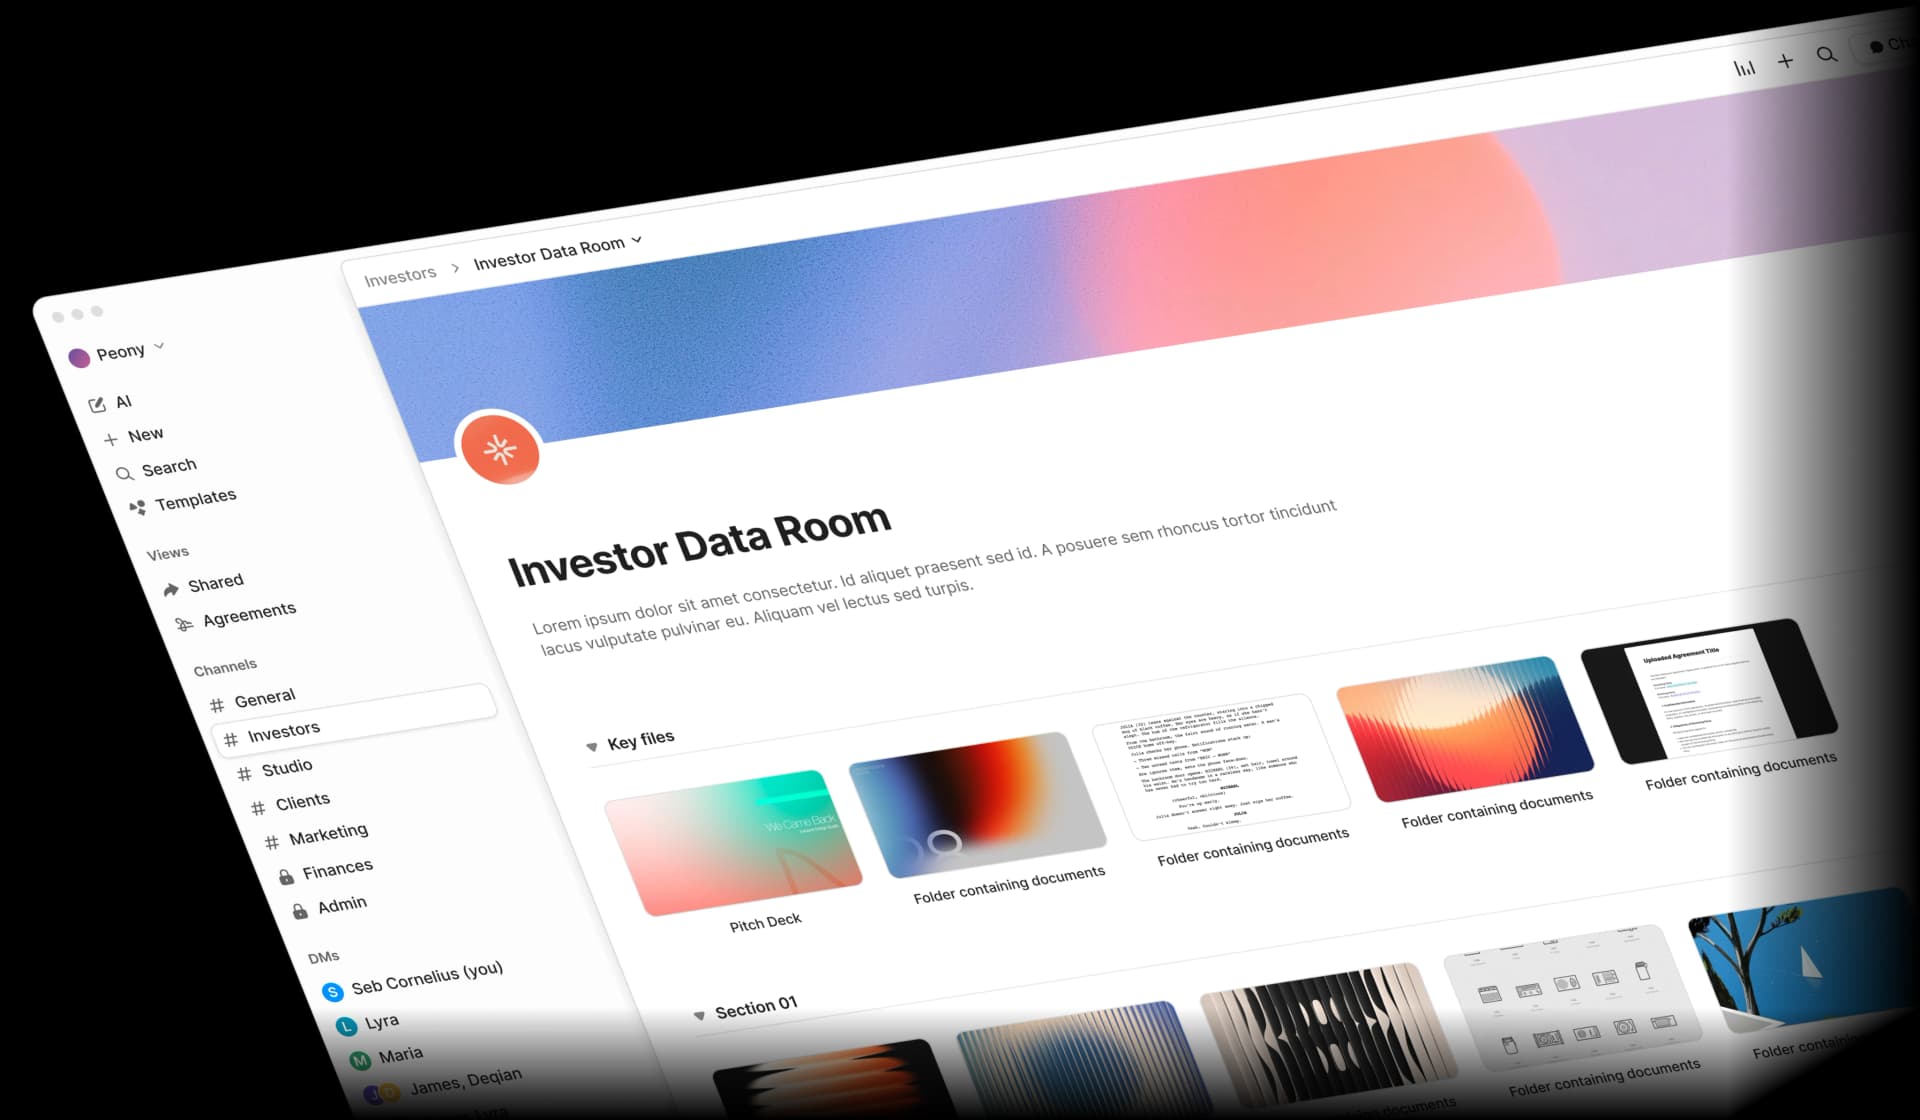
How it works:
- Upload your pitch deck PDF to Peony — takes under a minute
- Generate a personalised link for each investor (or a single tracked link for broader sharing)
- Share the link via email, LinkedIn message, or any channel
- When the investor opens the link, Peony's viewer loads the deck in their browser — no downloads, no software required
- Every interaction is tracked: which pages they view, how long they spend on each one, when they come back
What you see in the dashboard:
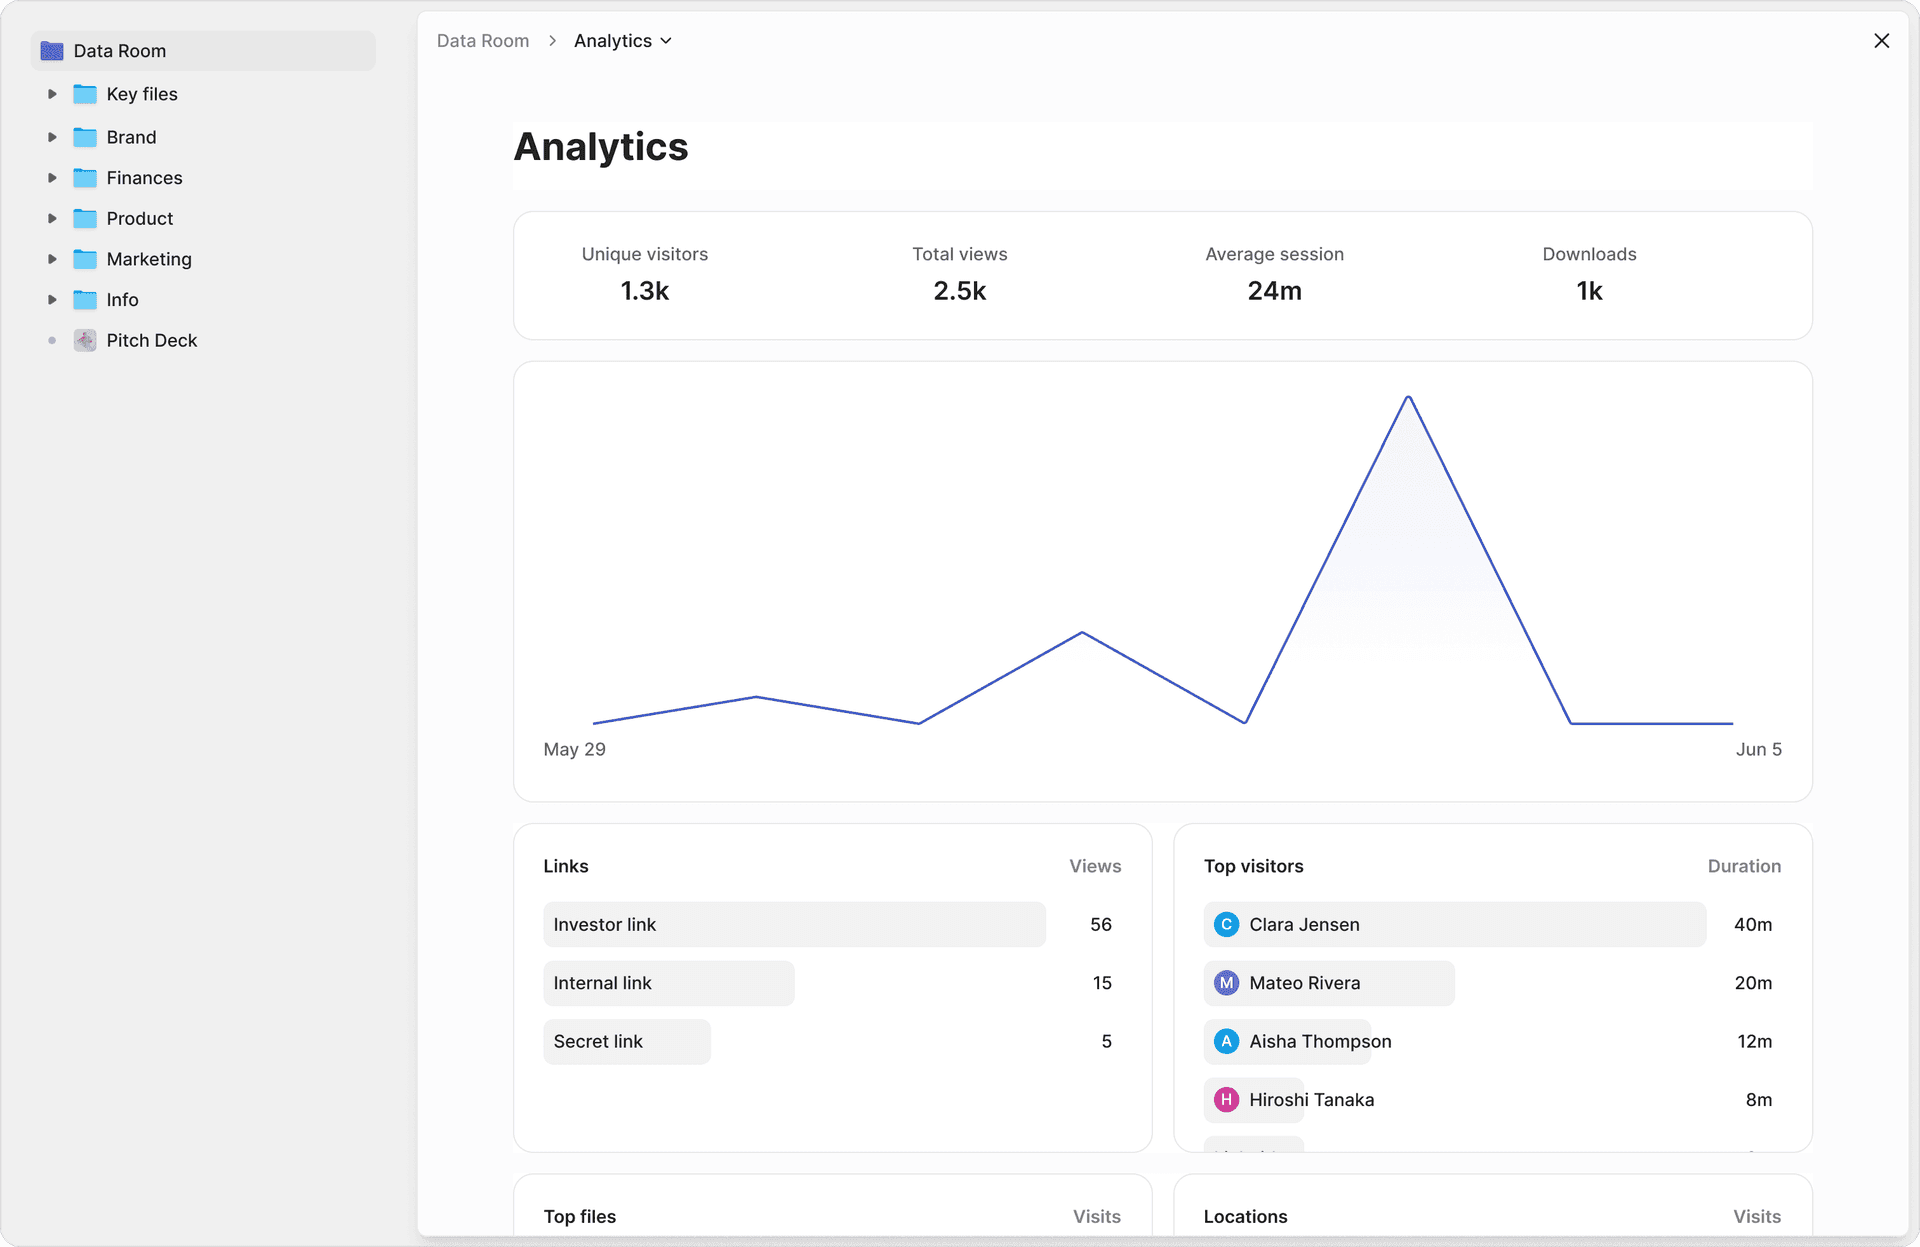
The analytics dashboard breaks down engagement per viewer. For each investor, you see:
- Total time spent — the overall duration across all sessions
- Page-by-page breakdown — seconds spent on every single slide
- View sequence — the order they navigated through the deck (did they jump straight to financials?)
- Session count — how many separate times they opened the link
- Revisited pages — which slides they came back to (this is the strongest interest signal)
- Device and location — useful for confirming viewer identity
- Download status — whether they saved a copy (if you have downloads enabled)
This level of detail is what turns analytics from a novelty into a fundraising tool. When I see an investor spend 4 minutes on my revenue model, skip the competitive landscape slide, and come back the next day to re-read the go-to-market strategy, I know exactly what my follow-up email should focus on.
Personalised links make tracking actionable:
With personalised links, every investor gets a unique URL. This means you are not looking at anonymous "someone viewed your deck" notifications — you are seeing "Sarah Chen at Sequoia spent 6 minutes on slides 4-8 and returned yesterday." That specificity is what makes the follow-up conversation feel natural instead of forced.
Security that builds investor confidence:
Your pitch deck contains sensitive financial data, growth projections, and strategic plans. Peony protects it with dynamic watermarks (the viewer's email is stamped on every page), screenshot protection that detects and blocks capture attempts, password protection for an additional access gate, and link expiration so access automatically cuts off when your round closes. For a complete rundown of every protection layer, see our guide on how to protect your pitch deck.
Pricing: Free tier available — includes page-level analytics, personalised links, watermarks, and screenshot protection. Pro at $20/month, Business at $40/month. No per-user fees. Viewers are always free.
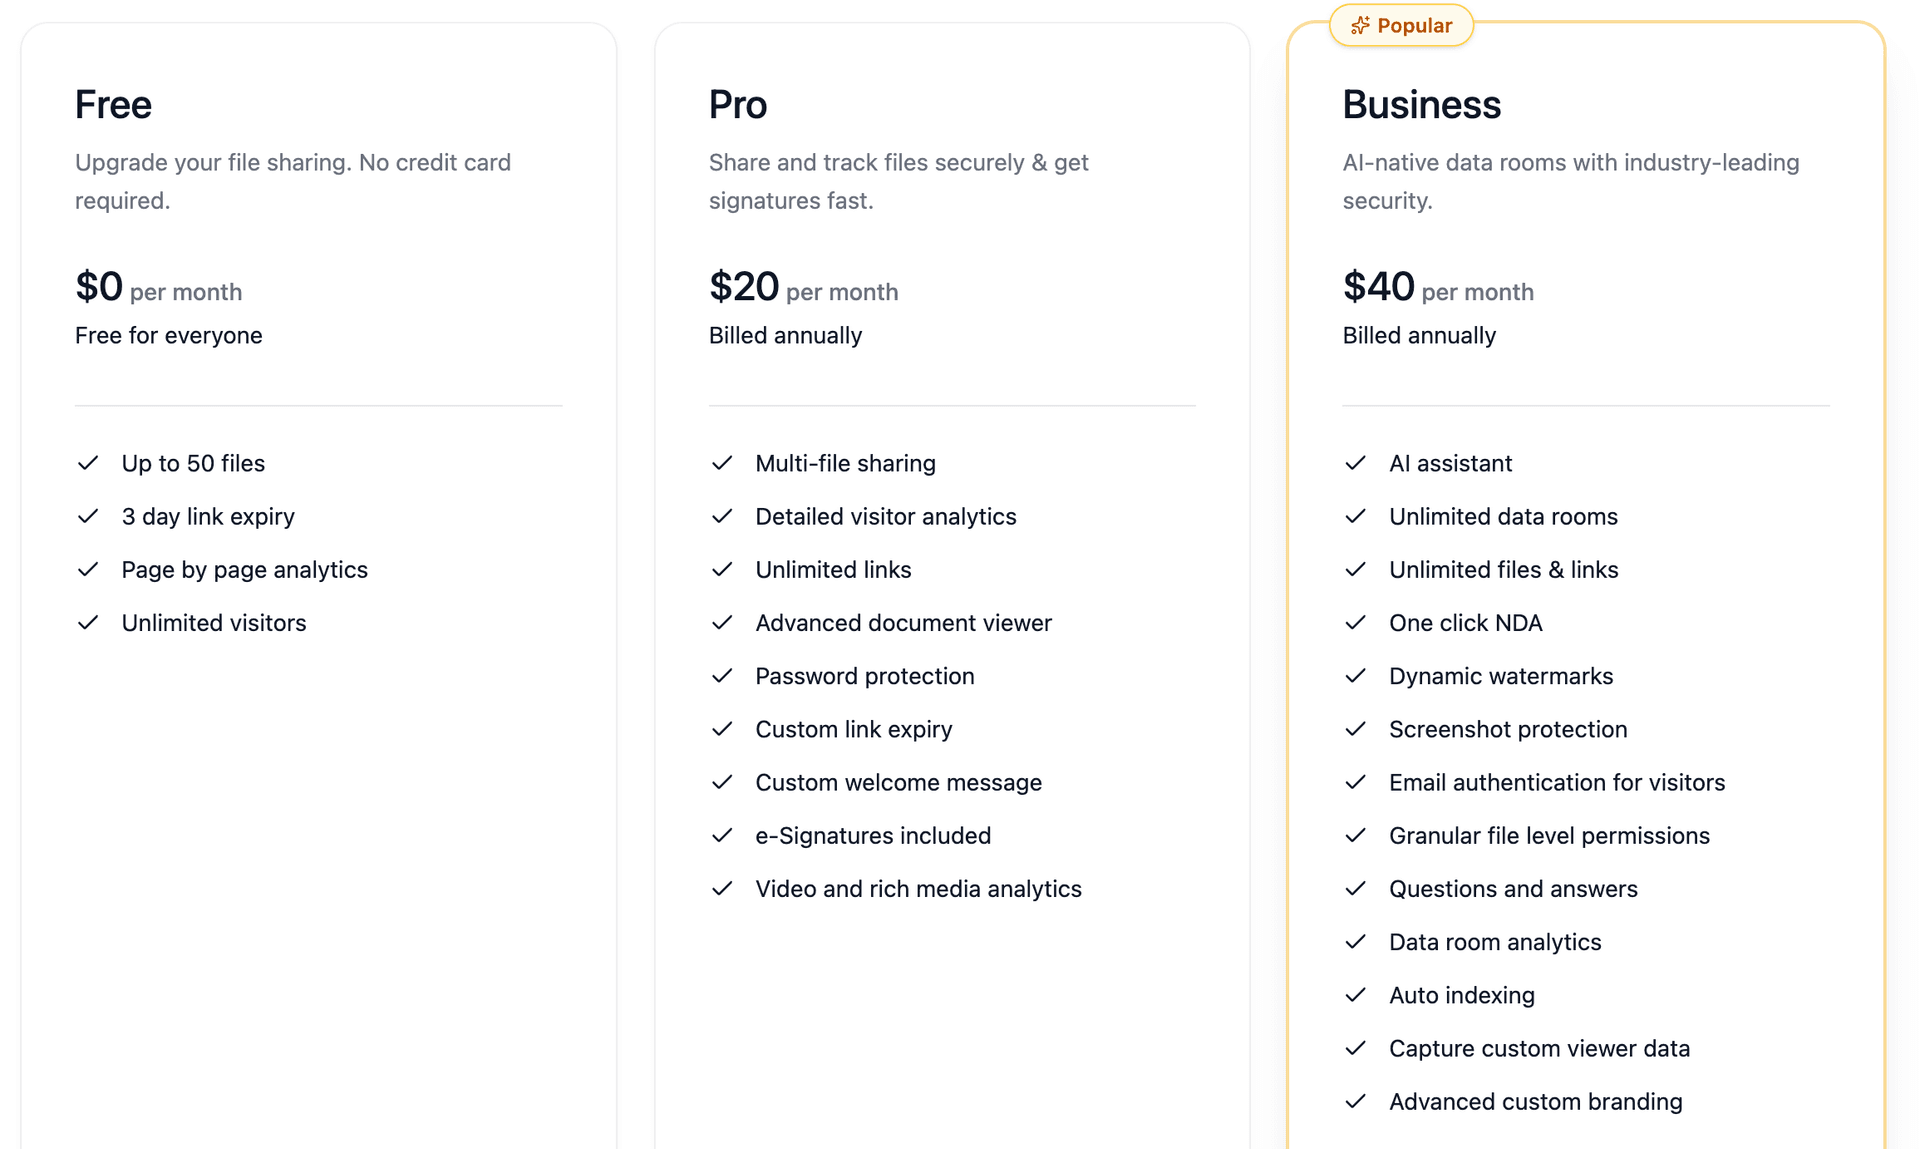
Pros: Page-level time tracking per slide. Revisit detection. Personalised links per investor. Dynamic watermarks. Screenshot protection. Free tier with full analytics. No per-user pricing. Purpose-built for fundraising workflows and venture capital deal management.
Cons: Requires sharing via link rather than email attachment (but that is the whole point — attachments are untrackable). Investors view in-browser rather than downloading a file.
Best for: Any founder sharing a pitch deck who wants to know which investors are genuinely interested, which slides matter most, and when to follow up. This is the method I use for every fundraising conversation, and it is the core of Peony's analytics platform.
Method 2: DocSend (basic page tracking)
DocSend was the original pitch deck tracking tool, launched in 2013 and acquired by Dropbox in 2021 for $165 million. It popularized the concept of tracked deck links in the startup world, and many VCs are familiar with seeing DocSend links in their inbox.
How it works:
- Upload your deck to DocSend
- Share the generated link
- See basic page-level analytics: which pages were viewed and approximate time per page
What you get:
- Page-by-page view tracking
- Viewer identification (if email capture is enabled)
- Basic time-per-page metrics
- Link-level controls (expiration, download toggles)
Pros: Well-known in the VC ecosystem. Basic page tracking works. Part of Dropbox, so it integrates with Dropbox storage.
Cons: $30/user/month with no free analytics tier. No dynamic watermarks. No screenshot protection. No AI-powered document organization. Since the Dropbox acquisition, the product has seen limited feature development — the interface and capabilities have not changed meaningfully since 2022. Per-user pricing means a 3-person founding team pays $90/month for basic tracking.
Best for: Founders already embedded in the Dropbox ecosystem who need straightforward page tracking and do not need advanced security or analytics features.
Method 3: Email read receipts (unreliable)
The simplest approach — and the least useful. Email read receipts (also called "return receipts" or "message disposition notifications") request a notification when the recipient opens your email.
How it works:
- In Gmail: use a third-party extension like Mailtrack or Streak
- In Outlook: enable "Request a Read Receipt" before sending
- In Apple Mail: not natively supported
What you get:
- A notification that the email was opened (maybe)
- No information about whether they opened the attachment
- No information about which slides they read
- No information about time spent
Pros: Free (or very cheap). No change to your sending workflow.
Cons: Most email clients block read receipts by default. Gmail does not support native read receipts for consumer accounts. Even when a receipt fires, it only tells you the email was opened — not that they downloaded or read the deck. Tracking pixels are blocked by most corporate email security systems. If you are attaching a PDF, the moment they download it, you lose all visibility.
Best for: Confirming an email was received when other tracking is not possible. Do not rely on this for fundraising intelligence.
Method 4: Google Drive activity dashboard (minimal)
If you share your pitch deck via Google Drive, you get some basic activity data — but far less than most founders expect.
How it works:
- Upload your deck to Google Drive
- Share the file with restricted access (specific email addresses)
- Open the file, click the trending icon (Activity dashboard)
What you get:
- A list of viewers (only Google Workspace accounts, not free)
- "Last viewed" timestamps
- Comment and edit history (for Google Docs/Sheets, not PDFs)
What you do not get:
- Which slides they viewed — Google Drive does not track page-level engagement
- Time spent — no duration data at all
- Return visits — no session tracking
- Anything useful for PDF files — the activity dashboard is designed for Google Docs, Sheets, and Slides, not uploaded PDFs
Pros: Free. Already built into Google Drive. No additional setup.
Cons: No page-level tracking. No time-per-slide data. Activity dashboard requires Google Workspace (paid) — free accounts get nothing. PDF files get almost zero analytics. Once a viewer downloads the file, all tracking stops. No watermarks, no screenshot protection, no link expiration on free accounts.
Best for: Verifying that a specific Google Workspace user accessed the file. Not useful for actual engagement analysis.
Method 5: PDF tracking pixels (hacky)
Some founders embed tiny invisible images (tracking pixels) inside their pitch deck PDF. When the PDF is opened and the image loads from a remote server, the server logs the request.
How it works:
- Create a 1x1 transparent image hosted on your server (or use a tracking service)
- Embed the image in your PDF using tools like Adobe Acrobat or HTML-to-PDF converters
- When someone opens the PDF and allows remote content, the image loads and logs a "view"
What you get:
- A notification that the PDF was opened (if remote content loading is enabled)
- IP address and approximate location
- Timestamp
What you do not get:
- Which pages were viewed — tracking pixels fire once on PDF open, not per page
- Time spent on any slide
- Viewer identity (unless you cross-reference IP addresses)
- Anything at all if the viewer's device blocks remote content (most corporate networks do)
Pros: Free to set up. Works across any sharing method (email attachment, download link, etc.).
Cons: Easily blocked — most PDF readers and corporate firewalls block remote content by default. Only fires on open, not per page. No time tracking. No viewer identification. Feels invasive when discovered. Some email security systems strip embedded tracking content before delivery. This method was clever in 2015 but has become increasingly unreliable as security tools have improved.
Best for: Technical founders who want a quick hack for basic open detection. Not reliable enough for fundraising decisions.
Method 6: Asking directly (the honest fallback)
Sometimes the simplest method is the right one. After sending your deck, follow up and ask.
How it works:
- Send the deck (ideally through a tracked link, but even a plain email works)
- Follow up 3-5 days later with a short, specific message
- Ask a question that reveals engagement without being pushy
Example follow-up messages:
- "Hi [Name], I shared our deck last week — did anything stand out that you would like to discuss further?"
- "Following up on the deck I sent Tuesday. Happy to walk through the financials in more detail if that would be helpful."
- "Quick question — did the market size framing in the deck resonate with your thesis on [their focus area]?"
Pros: Free. Builds real relationships. Gets qualitative feedback that no analytics tool can provide. Investors respect founders who follow up professionally.
Cons: Investors who are not interested will often not respond at all — so silence is your signal, but it is ambiguous. You cannot tell the difference between "never opened it" and "read it carefully and decided to pass." You are dependent on the investor's willingness to respond.
Best for: Combining with a tracked method. Use Peony's analytics to identify engaged investors, then follow up with a personalized message that references what you know they cared about. The analytics tell you who to contact and what to say. The direct conversation builds the relationship.
What pitch deck analytics actually tell you
Raw data is useless without interpretation. Here is how to read the engagement signals that Peony's analytics dashboard surfaces, based on patterns I have observed across hundreds of deck shares.
The engagement signals that matter
Signal 1: Total time spent
This is your primary interest indicator. Based on what I have seen across Peony's platform:
- Under 1 minute — They skimmed the cover and maybe one or two slides. Low interest or bad timing. Do not follow up aggressively.
- 1-2 minutes — A quick scan. Moderate interest at best. Worth a gentle follow-up in 5-7 days.
- 3-5 minutes — A serious review. They read most of the deck. Follow up within 24-48 hours.
- Over 5 minutes — Deep engagement. They are actively evaluating you. Follow up the same day if possible.
Signal 2: Which slides they revisited
Return visits to specific slides are the strongest interest signal in pitch deck analytics. An investor who views your revenue model once might be casually scanning. An investor who comes back to your revenue model on a second session is building an internal case for the investment.
Pay special attention to repeat views on:
- Financial slides (revenue model, unit economics, projections) — They are validating whether the numbers work
- Market size slides — They are checking if the opportunity fits their fund thesis
- Traction slides (customers, revenue, growth) — They are assessing whether you have product-market fit
- Team slides — They are evaluating whether you can execute
Signal 3: The skip pattern
What investors skip is as revealing as what they read. If every viewer skips your competitive landscape slide, that slide is not working. If investors consistently jump from the problem slide directly to traction (skipping the solution slides), your solution narrative may not be compelling enough.
I have used skip patterns to restructure pitch decks mid-round. During one fundraising push, I noticed that investors were consistently spending under 5 seconds on my "Why Now" slide. I rewrote it with a specific regulatory timeline and a chart showing market acceleration — and the average time on that slide jumped to over 40 seconds in the next batch of shares.
Signal 4: Multi-viewer activity from the same fund
When two or three people from the same firm access your deck within a few days, that is internal circulation. Someone showed it to their partners. This is one of the strongest positive signals you can get — it means your deck survived the first filter and is being seriously discussed.
On Peony, you will see distinct viewers from the same email domain. When this happens, move fast. Send a message acknowledging the interest and suggest a partner meeting. This is also the signal to start preparing your full data room for due diligence.
Engagement scoring: hot, warm, and cold
Here is the framework I use to prioritize follow-ups based on Peony's analytics:
Hot (follow up within 24 hours):
- Viewed 80 percent or more of slides
- Total time over 4 minutes
- Two or more sessions
- Financial slides viewed multiple times
- Multiple viewers from the same fund
Warm (follow up within 3-5 days):
- Viewed 60-80 percent of slides
- Total time 2-4 minutes
- Single session with good depth
- At least one high-engagement slide
Cold (low priority, follow up after 7 or more days):
- Viewed fewer than 60 percent of slides
- Total time under 2 minutes
- No return visits
- Skipped financial and traction slides
Unresponsive (deprioritize):
- Never opened the link
- Opened but closed within 30 seconds
- No engagement after two follow-up attempts
How to follow up based on engagement data
Tracking is only valuable if it changes what you do. Here is how to turn Peony's analytics into better follow-up conversations.
Timing your follow-up
The best follow-up window is within 24 hours of a high-engagement view. Your startup is fresh in the investor's mind. They have questions forming. If you wait a week, you are competing with every other deck they reviewed since then.
For moderate engagement, 3-5 days gives them space without losing momentum. For low engagement, a follow-up after 7-10 days with a different angle (new traction data, press coverage, a warm intro from a mutual connection) can re-engage.
Personalizing the conversation
This is where analytics go from "nice to have" to "competitive advantage." Instead of generic follow-ups, reference what you know they cared about:
If they spent time on financials: "Hi [Name], happy to walk through our unit economics in more detail — our CAC payback improved to [X] months this quarter, and I can share the underlying cohort data."
If they focused on traction: "Following up on the deck — since you reviewed it, we closed [X new customers / hit Y ARR milestone / launched in Z market]. Happy to share the updated numbers."
If they lingered on the team slide: "Noticed you reviewed our team backgrounds. Worth mentioning that [new hire / advisor] just joined — she led [relevant experience] at [known company]."
If multiple people from their fund viewed the deck: "It looks like your team has been reviewing our materials — would it make sense to set up a partner meeting to discuss the opportunity directly?"
None of these messages reveal that you are tracking slides. They are framed as natural updates and relevant context. The analytics simply tell you which framing will resonate.
The follow-up cadence I use
- Day 0: Share the deck via Peony personalised link
- Within 24 hours of high engagement: Personalized follow-up referencing their interests
- Day 5 (if no response but good engagement): Share a new data point or piece of traction
- Day 10 (if still no response): Brief check-in, offer to reconnect when timing is better
- Day 20+: Move to quarterly newsletter or batch update
If an investor never opened the deck after 10 days, a warm re-intro through a mutual connection is worth more than a fourth email.
Comparison table: all tracking methods
| Feature | Peony (Secure Platform) | DocSend | Email Read Receipts | Google Drive | PDF Tracking Pixels | Asking Directly |
|---|---|---|---|---|---|---|
| Page-level tracking | Yes (time per slide) | Yes (basic) | No | No | No | No |
| Time per slide | Yes (seconds) | Yes (approximate) | No | No | No | No |
| Revisit detection | Yes | Yes | No | No | No | No |
| Viewer identification | Yes (email + fund) | Yes (if enabled) | Unreliable | Workspace only | IP only | Manual |
| Personalised links | Yes | No (shared links) | N/A | N/A | N/A | N/A |
| Dynamic watermarks | Yes | No | No | No | No | No |
| Screenshot protection | Yes | No | No | No | No | No |
| Password protection | Yes | Yes | No | No | No | No |
| Link expiration | Yes | Yes | No | Workspace only | No | No |
| Free tier with analytics | Yes | No ($30/user/mo) | Yes (limited) | No (Workspace) | Yes (DIY) | Yes |
| Works with email attachments | No (link-based) | No (link-based) | Yes | No | Yes | Yes |
| Reliability | High | High | Low | Low | Low | Variable |
My take: If you are fundraising and sharing a pitch deck, Peony gives you the most actionable intelligence at any price point — including free. The page-level time tracking, revisit detection, and personalised links per investor turn your deck from a static PDF into a live signal about who is interested and what they care about. Combine the analytics with direct follow-up conversations for the strongest fundraising workflow.
Practical tips for better pitch deck tracking
These are lessons from my own fundraising experience and from watching how investors interact with decks on Peony's platform.
Always share links, never attachments. The moment you attach a PDF to an email, you lose all visibility. The investor downloads it, and you will never know if they read it, forwarded it, or deleted it. A Peony link keeps you connected to the document — you see every interaction, and you can revoke access if needed.
Use personalised links for your top-priority investors. A single shared link gives you aggregate data. Personalised links give you per-investor data. When you are targeting 10 specific funds, create a unique link for each one. You will know exactly which partner at which fund is engaging.
Set link expiration to match your round timeline. If you are targeting a close in 8 weeks, set links to expire in 10 weeks. This prevents old versions of your deck from circulating after the round closes. Peony lets you set link expiry per link, so you can extend access for active conversations while cutting off stale ones.
Enable watermarks for sensitive decks. Dynamic watermarks embed the viewer's email into every page. This does not prevent screenshots, but it makes leaks attributable — and that changes behavior. I have noticed that investors handle watermarked decks with visibly more care. For the full security playbook, see our guide on protecting your pitch deck.
Check your analytics before every investor call. Pull up the investor's viewing history in Peony's dashboard before every call. Know which slides they spent time on, which they skipped, and whether they returned. This is your preparation cheat sheet — it tells you what to lead with and what to skip.
Iterate your deck based on engagement data. If slide 6 consistently gets skipped, rewrite it or remove it. If investors are dropping off after slide 10, your deck might be too long. If the financial slides get the most repeat views, consider moving them earlier. The analytics are not just for follow-ups — they are feedback on your deck itself. Once you are raising in earnest, our seed funding guide walks through the full process from target list to term sheet.
Bottom line
Tracking pitch deck engagement is the difference between fundraising with data and fundraising with hope. The investors who are going to write you a check are leaving signals in how they interact with your deck — which slides they read, how long they spent, whether they came back, whether they shared it internally. The question is whether you are capturing those signals.
- Need slide-by-slide analytics, time tracking, and revisit detection → Peony (free tier, page-level analytics, personalised links, watermarks, screenshot protection)
- Already in the Dropbox ecosystem and need basic tracking → DocSend ($30/user/month)
- Sharing via Google Drive → You are getting almost no engagement data. Consider switching to a tracked link.
- Relying on email receipts or tracking pixels → These are too unreliable for fundraising decisions.
We built Peony's analytics because I was tired of sending decks into the void and guessing. The signal was always there in how investors interacted with the deck — I just needed a way to see it. If you are fundraising, try Peony for free and set up a tracked data room in minutes. You will never send a blind deck again.
FAQ
What is pitch deck tracking and why does it matter for fundraising?
Pitch deck tracking means monitoring who opens your investor deck, which slides they view, how long they spend on each page, and whether they return for a second look. It matters because investors rarely tell you they are not interested — they just go quiet. With Peony's page-level analytics, you can see exactly which slides each investor read, identify who is genuinely engaged versus politely browsing, and time your follow-ups based on real behavior instead of guesswork.
How does Peony track pitch deck engagement?
Peony tracks pitch deck engagement at the individual page level. When you share your deck through a Peony personalised link, the platform records who opened it, which slides they viewed, how many seconds they spent on each page, whether they returned for additional sessions, and what device they used. The analytics dashboard surfaces this data in real time, so you can see the moment an investor opens your deck and watch their engagement unfold slide by slide.
Can I see which specific slides an investor viewed in my pitch deck?
Yes. Peony's page-level analytics show exactly which slides each viewer opened, in what order, and for how long. If an investor spent 4 minutes on your revenue model but skipped the team slide entirely, you will see that in the dashboard. This per-slide granularity is what separates Peony from tools that only tell you whether someone opened a link — it shows you what they actually cared about.
Is it possible to track pitch deck views for free?
Yes. Peony offers a permanent free tier that includes page-level analytics, personalised links, dynamic watermarks, and screenshot protection. You can upload your pitch deck, generate a tracked link, and start seeing who views which slides immediately — no credit card required. The free plan covers the core analytics most founders need during fundraising.
How do I know if an investor is actually interested in my startup?
Investor interest shows up in engagement patterns. On Peony, a genuinely interested investor typically views 80 percent or more of your slides, spends 3 or more minutes total, returns for a second session within a few days, and often lingers on financial slides. If multiple viewers from the same fund access your deck, that is a strong signal the deal is being discussed internally. These behavioral signals are far more reliable than email responses.
What is the best way to follow up with investors after sharing a pitch deck?
The best follow-up strategy is data-driven. With Peony's analytics, you can see exactly when an investor viewed your deck and which slides held their attention. Follow up within 24 hours of a high-engagement view. Reference their specific interests — if they spent time on unit economics, offer to walk through your financial model. If they viewed your deck multiple times, that signals serious interest and warrants a direct meeting request.
Can investors tell that I am tracking their pitch deck views?
Peony's tracking is built into the document viewing experience and does not require any special software or browser extensions on the investor's side. Investors access your deck through a standard browser link. The tracking is transparent in the sense that professional investors expect shared decks to be tracked — it is standard practice in fundraising. Peony does not inject visible tracking pixels or alter the viewing experience.
How does Peony compare to DocSend for pitch deck tracking?
Peony provides page-level analytics with time-per-slide tracking, revisit detection, personalised links per investor, dynamic watermarks, screenshot protection, and a permanent free tier. DocSend offers basic page-level tracking but charges $30/user/month with no free plan for analytics, does not include screenshot protection or dynamic watermarks, and was acquired by Dropbox in 2021. For founders who want deeper engagement signals and security without per-user costs, Peony is the more complete platform.
What pitch deck metrics should I track during a fundraising round?
The most actionable metrics are: total time spent viewing (under 1 minute signals low interest, over 3 minutes signals serious engagement), slide-level time distribution (which pages held attention), completion rate (what percentage of slides they viewed), return visits (investors who come back are actively evaluating), and multi-viewer activity from the same fund (signals internal discussion). Peony surfaces all of these metrics in its analytics dashboard, organized by investor.
Can I track engagement on pitch decks shared through email?
If you attach a PDF directly to an email, you cannot track engagement at all — the file lives on the recipient's device with no connection back to you. Instead, share a Peony link in your email. When the investor clicks the link, they view your deck in Peony's secure viewer, and every interaction is tracked — page views, time per slide, downloads, and return visits. This is why experienced founders never attach decks as raw PDF files.
Related Resources
- How to Send a Pitch Deck to Investors
- Protect Your Pitch Deck from Unauthorized Sharing
- DocSend Pricing Review
- DocSend Alternatives
- Startup Fundraising Strategy
- VC Fund Data Room Checklist
- Data Room for Investors
- Virtual Data Room Cost Guide
- AI Pitch Deck Guide
- Best Data Rooms for Startups
- Seed Funding Guide
- Brieflink Alternatives
- Digital Sales Room Guide
- Best Sales Enablement Software
- Secure File Sharing Guide
- How to Password Protect Videos
- Peony Pricing