
How to Build a Pitch Deck Accurately with AI in 2026

Co-founder at Peony. Former VC at Backed VC and growth-equity investor at Target Global — I write about investors, fundraising, and deal advisors from the deal-side perspective I spent years in.
Set up my next data room with SeanLast updated: March 2026
We run Peony, a data room and secure document sharing platform built for fundraising. Over the past two years I have helped dozens of founders create pitch decks with AI tools — and the gap between "AI-generated" and "AI-assisted but founder-driven" is enormous. The first category produces decks that VCs recognize as generic within three slides. The second produces decks that close rounds.
The problem is not the AI. The problem is the workflow. Most founders open an AI tool, type "create a pitch deck for my SaaS startup," and get back 15 slides of filler. Then they spend days trying to fix the output instead of directing it properly from the start.
This guide is the workflow I actually use and recommend. It consistently produces investor-ready decks in under 5 hours — including the human polish pass that turns "AI draft" into "fundable."
TL;DR: AI is a strong first-draft teammate, not your fundraising brain. The 7-step workflow below — truth document, narrative choice, slide map, AI draft, human polish, design system, secure sharing — produces investor-ready decks in 4-5 hours instead of 40-80. Use AI for structure and copy, add your real numbers and voice, then share through Peony (free) with per-page analytics, dynamic watermarks, and screenshot protection so you know exactly which slides land.
Quick guide — jump to the step you need:
- Starting from scratch? → Write your truth document — Step 1
- Have content, need structure? → Generate narrative options — Step 2
- Ready to build slides? → AI first draft — Step 4
- Draft done, need polish? → Human polish pass — Step 5
- Deck finished, need to share? → Secure sharing — Step 7
What AI is great at (and what it is not)
Before diving into the workflow, set the right expectations. AI is not a replacement for your fundraising brain — it is an accelerator for specific tasks.
AI is great at:
- Turning messy notes into a clean outline and slide flow
- Generating multiple copy variations quickly (headlines, one-liners, tighter bullets)
- Creating visual starting points (themes, layouts, draft slides)
- Producing data visualization suggestions based on your numbers
- Running investor objection rehearsals against your narrative
AI is not great at:
- Knowing what is true about your traction, market, or unit economics
- Deciding what to omit (which is often what makes a deck feel high-quality)
- Creating defensible numbers or claims without your data
- Adding authentic founder voice that builds trust with investors
- Understanding the strategic nuance of your competitive position
The trick is: use AI to accelerate structure and expression, but anchor every claim in your reality.
The 7-step AI pitch deck workflow
Step 1: Write a 10-line truth document (before you touch slides)
This takes 15 minutes and saves you hours. Every AI interaction after this step feeds from this document. Open a blank doc and write one sentence for each:
- Company in one sentence
- Customer and pain in one sentence
- Your solution in one sentence
- Why now (timing)
- What you have built (demoable proof)
- Traction (numbers only — ARR, MoM growth, users, retention)
- Business model (who pays, how much, why)
- Go-to-market (first wedge + distribution)
- Competition (why you win)
- Ask (round size, what it buys, milestones it unlocks)
This is your "source of truth." Every prompt you give AI references this document. Without it, AI fills in blanks with plausible-sounding fiction — and investors catch fiction immediately.
Step 2: Ask AI to produce three deck narratives
Do not ask for slides yet. Ask for story options:
- Narrative A: "Mission-first" — vision, then proof. Works best when the market insight is genuinely novel.
- Narrative B: "Traction-first" — numbers, then expansion. Works best when your growth metrics are strong.
- Narrative C: "Contrarian insight" — new category, new wedge. Works best when you are creating or redefining a space.
Pick one. Your deck becomes dramatically more coherent when the narrative is chosen first, before any slides exist. Most generic AI decks fail here — they default to "Mission-first" regardless of whether the founder has any traction to back it up.
Step 3: Generate a slide map (not slide text)
A great pitch deck is usually 10-15 slides covering these "jobs to be done": Problem, Solution, Market, Product, Traction, GTM, Moat, Team, Ask. This maps to the standard structure VCs expect from pre-seed through Series A.
Have AI output for each slide:
- Slide title
- The one sentence that slide must prove
- 3 bullets max (supporting evidence)
- Suggested visual (chart, screenshot, diagram)
If a slide cannot be described in one sentence, it is probably not ready. Merge or split until every slide has a single clear job.
Step 4: Use AI presentation tools to draft slides fast
Your goal here is not perfection. Your goal is a complete, editable first draft in under 90 minutes. Pick the lane that matches your workflow:
Established tools with AI features:
- PowerPoint with Copilot — generates a presentation from a prompt or from a Word outline. Best if your team already lives in Microsoft 365.
- Google Slides with Gemini — helps generate content, summarize, and assist inside Workspace workflows. Best for teams already in Google Workspace.
- Canva AI — assists with rapid layout and content creation. Best for founders who want design flexibility without design skills.
AI-native presentation tools:
- Gamma — turns text outlines into complete slide drafts with visuals. Best for speed when you already have strong content.
- Beautiful.ai — auto-adjusts layouts as you type and enforces design rules. Best for maintaining visual consistency.
- Tome — generates narrative-driven presentations with matching visuals. Best for storytelling-heavy decks.
Whichever tool you choose, feed it your truth document and slide map from Steps 1-3. The quality difference between "generate a pitch deck" and "generate slides from this specific outline with these specific data points" is night and day.
Step 5: Human polish pass (this is where decks become fundable)
This is the most important step. AI gives you 80% of a deck — but the last 20% is what makes investors lean forward instead of clicking away.
First pass — clarity and credibility:
- One idea per slide. If it is two ideas, split it.
- Kill paragraphs. Slides are not essays. No investor reads dense text on a slide.
- Make claims measurable. Replace "fast growth" with "22% MoM for 6 months." Replace "large market" with "$4.2B TAM growing 18% annually."
- Visuals over adjectives. Show the chart, not "massive demand."
- Verify every number. AI fabricates statistics confidently. Cross-check every data point against your truth document.
Second pass — tone and voice:
- Calm, confident, specific. Not salesy, not desperate, not vague.
- Add founder-specific language: reference your actual customers, your actual conversations with investors, your actual product screenshots.
- Remove anything that sounds like it could appear in any pitch deck. If a sentence is true for 100 startups, it is not adding value to yours.
Step 6: Upgrade the design system (without over-designing)
You want "clean, inevitable, professional." AI tools generate layouts, but taste is consistency — and consistency is what signals credibility to investors.
Design rules that matter:
- One font family, two weights maximum
- A tight color palette (1 accent color, neutral background)
- Consistent spacing and alignment (use grids)
- Repeated components (same chart style, same header format, same bullet treatment)
- White space. More than you think you need.
Common AI design mistakes to fix:
- Decorative gradients and effects that distract from content
- Inconsistent icon styles (mixing flat, outlined, and 3D)
- Stock photos that add nothing — replace with product screenshots or leave the space empty
- Tiny text that looks fine on your laptop but is unreadable when an investor views on their phone
Step 7: Share it through a trackable, secure link
This is where most founders lose momentum. They spend 4-5 hours building a strong deck, then email it as Pitch_Deck_v7_FINAL.pdf and guess whether anyone opened it.
Why email attachments fail for fundraising:
- Zero analytics — you have no idea if anyone opened it
- No version control — different investors have different versions of your financials
- No security — once downloaded, the file circulates freely
- No access revocation — you cannot pull it back
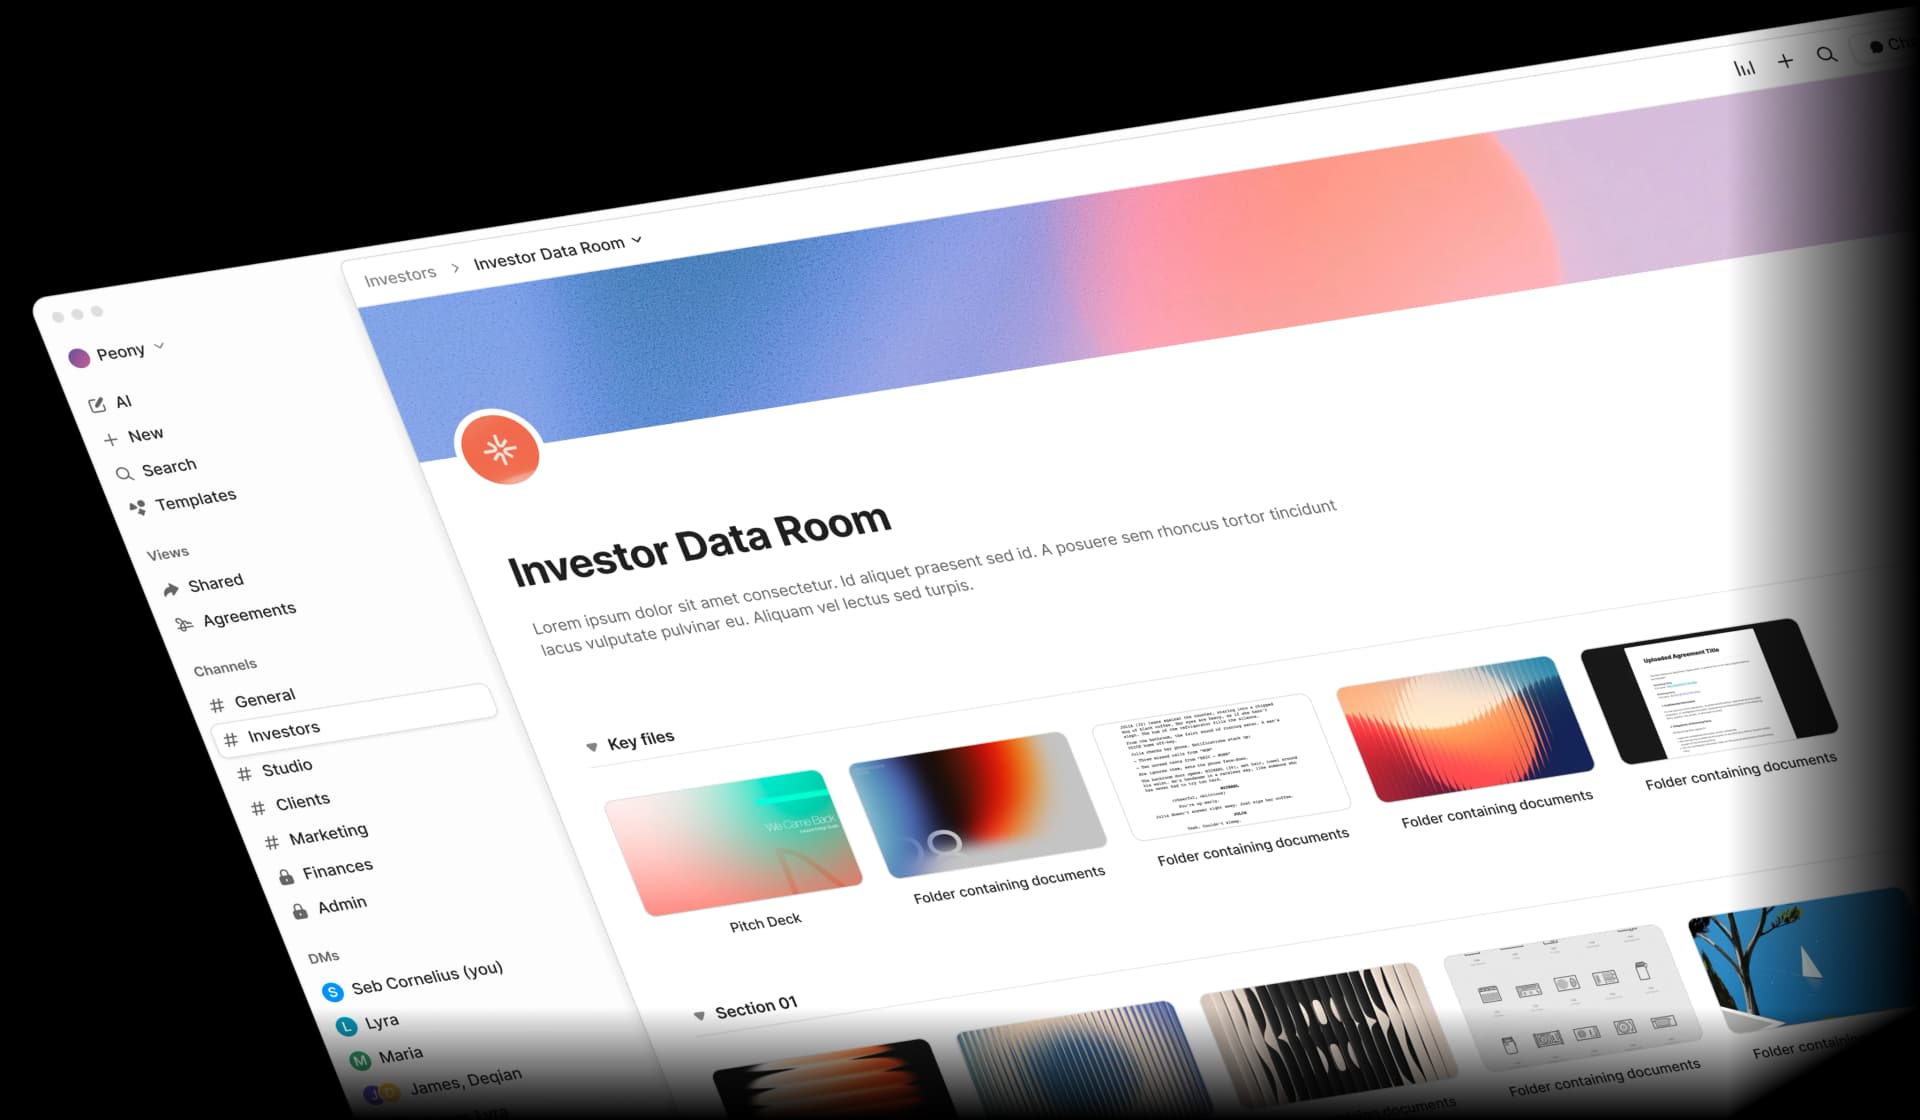
The better approach: Upload your finished deck to Peony and share a single trackable link. Here is the workflow I recommend:
- Create a fundraising data room in Peony
- Upload your AI-polished pitch deck PDF
- Configure security settings: enable dynamic watermarks, turn on email verification, set screenshot protection
- Generate a shareable link — this is the only URL you use everywhere
- Share with investors and watch the analytics come in
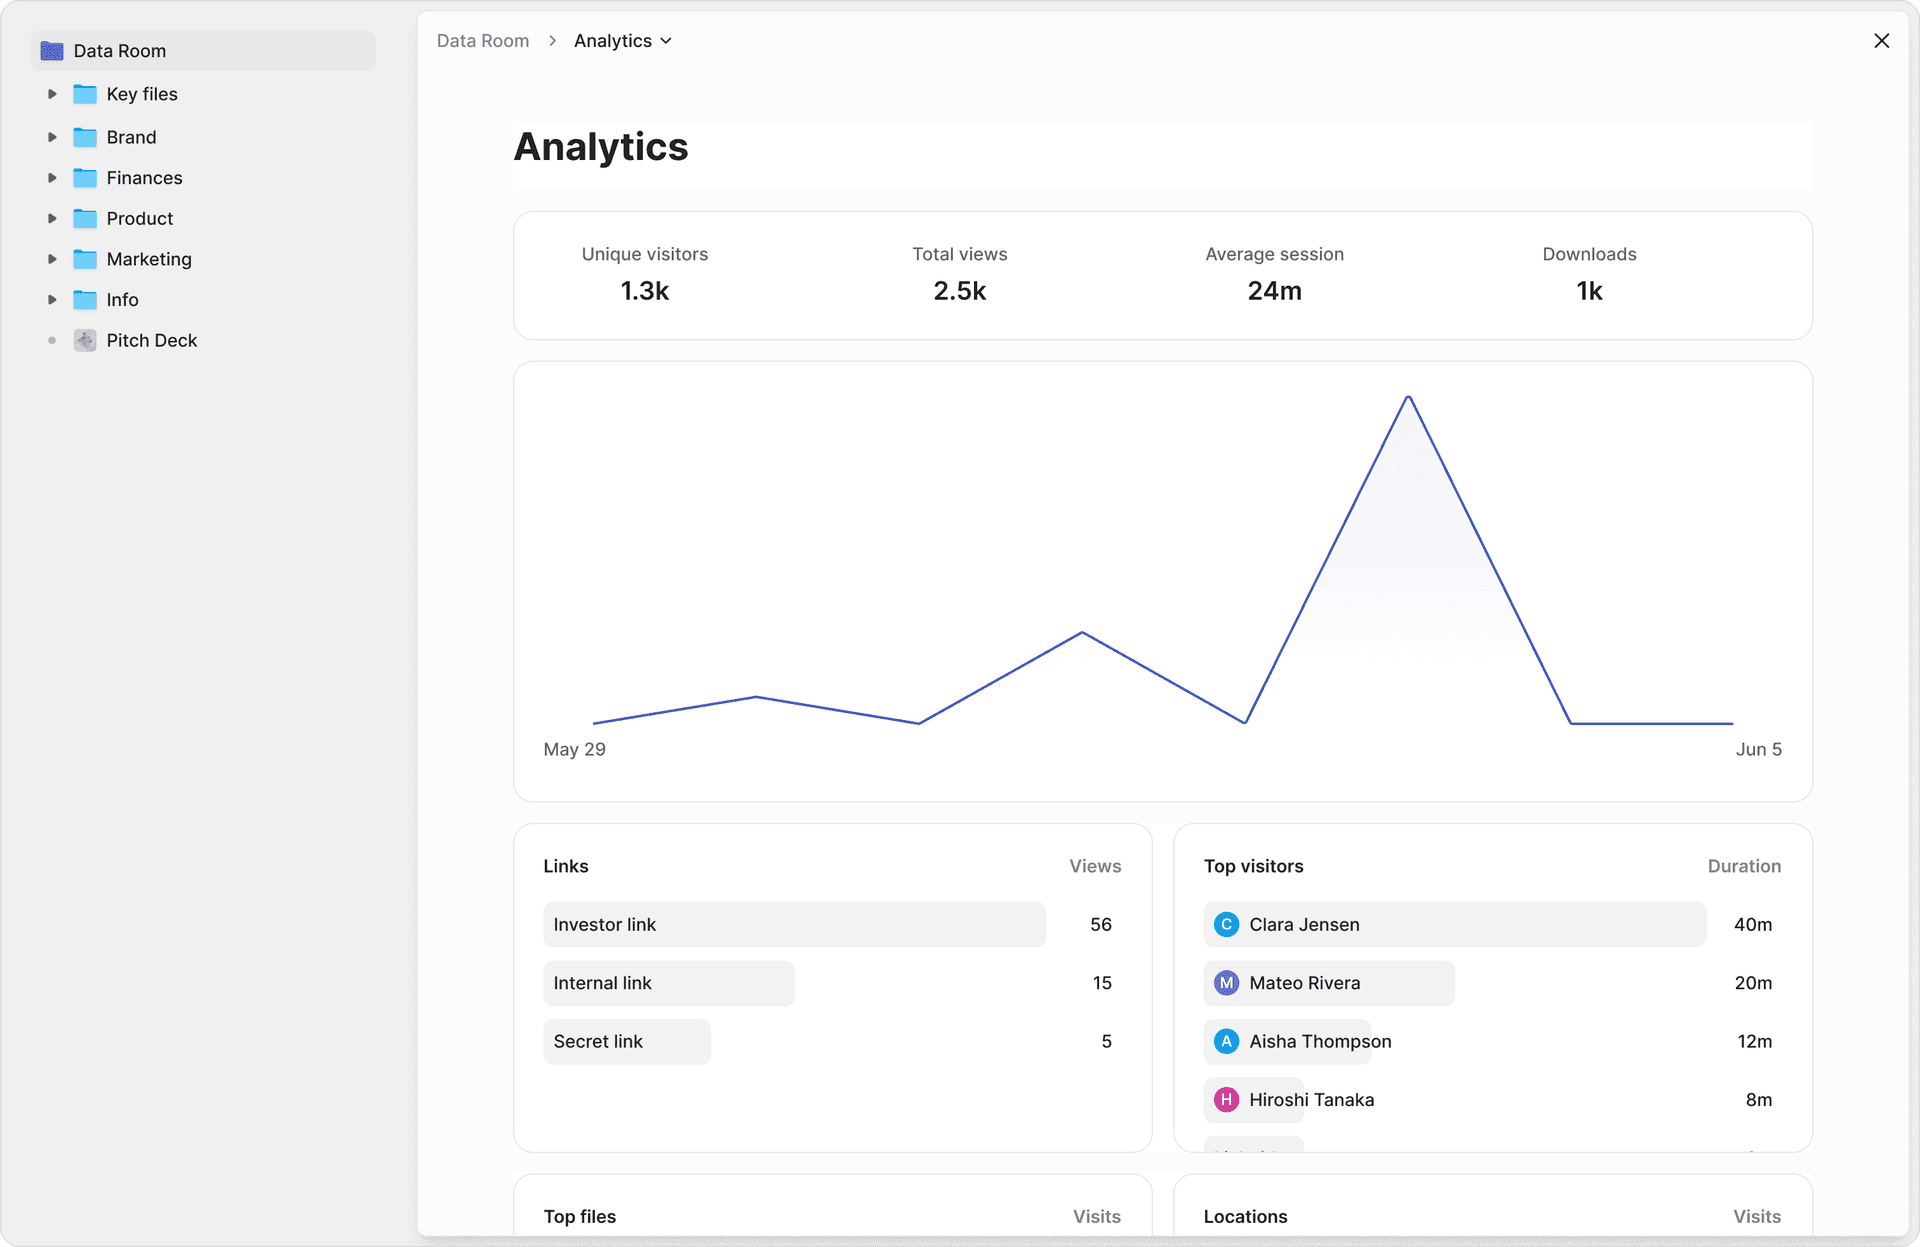
What you see with Peony analytics:
- Which investors opened the deck and when
- Time spent on each slide (the traction slide getting 45 seconds while the team slide gets 3 seconds tells you something)
- Return visits (strong interest signal — especially multiple viewers from the same fund)
- Drop-off points (if everyone stops at slide 8, fix slide 8)
Security that matters during fundraising:
- Identity-bound access — only verified email addresses can view
- Dynamic watermarks — each viewer's email stamped on every page
- Screenshot protection — deters unauthorized captures
- Link expiry — access automatically ends after your specified date
- Version control — update the deck and the same link serves the new version
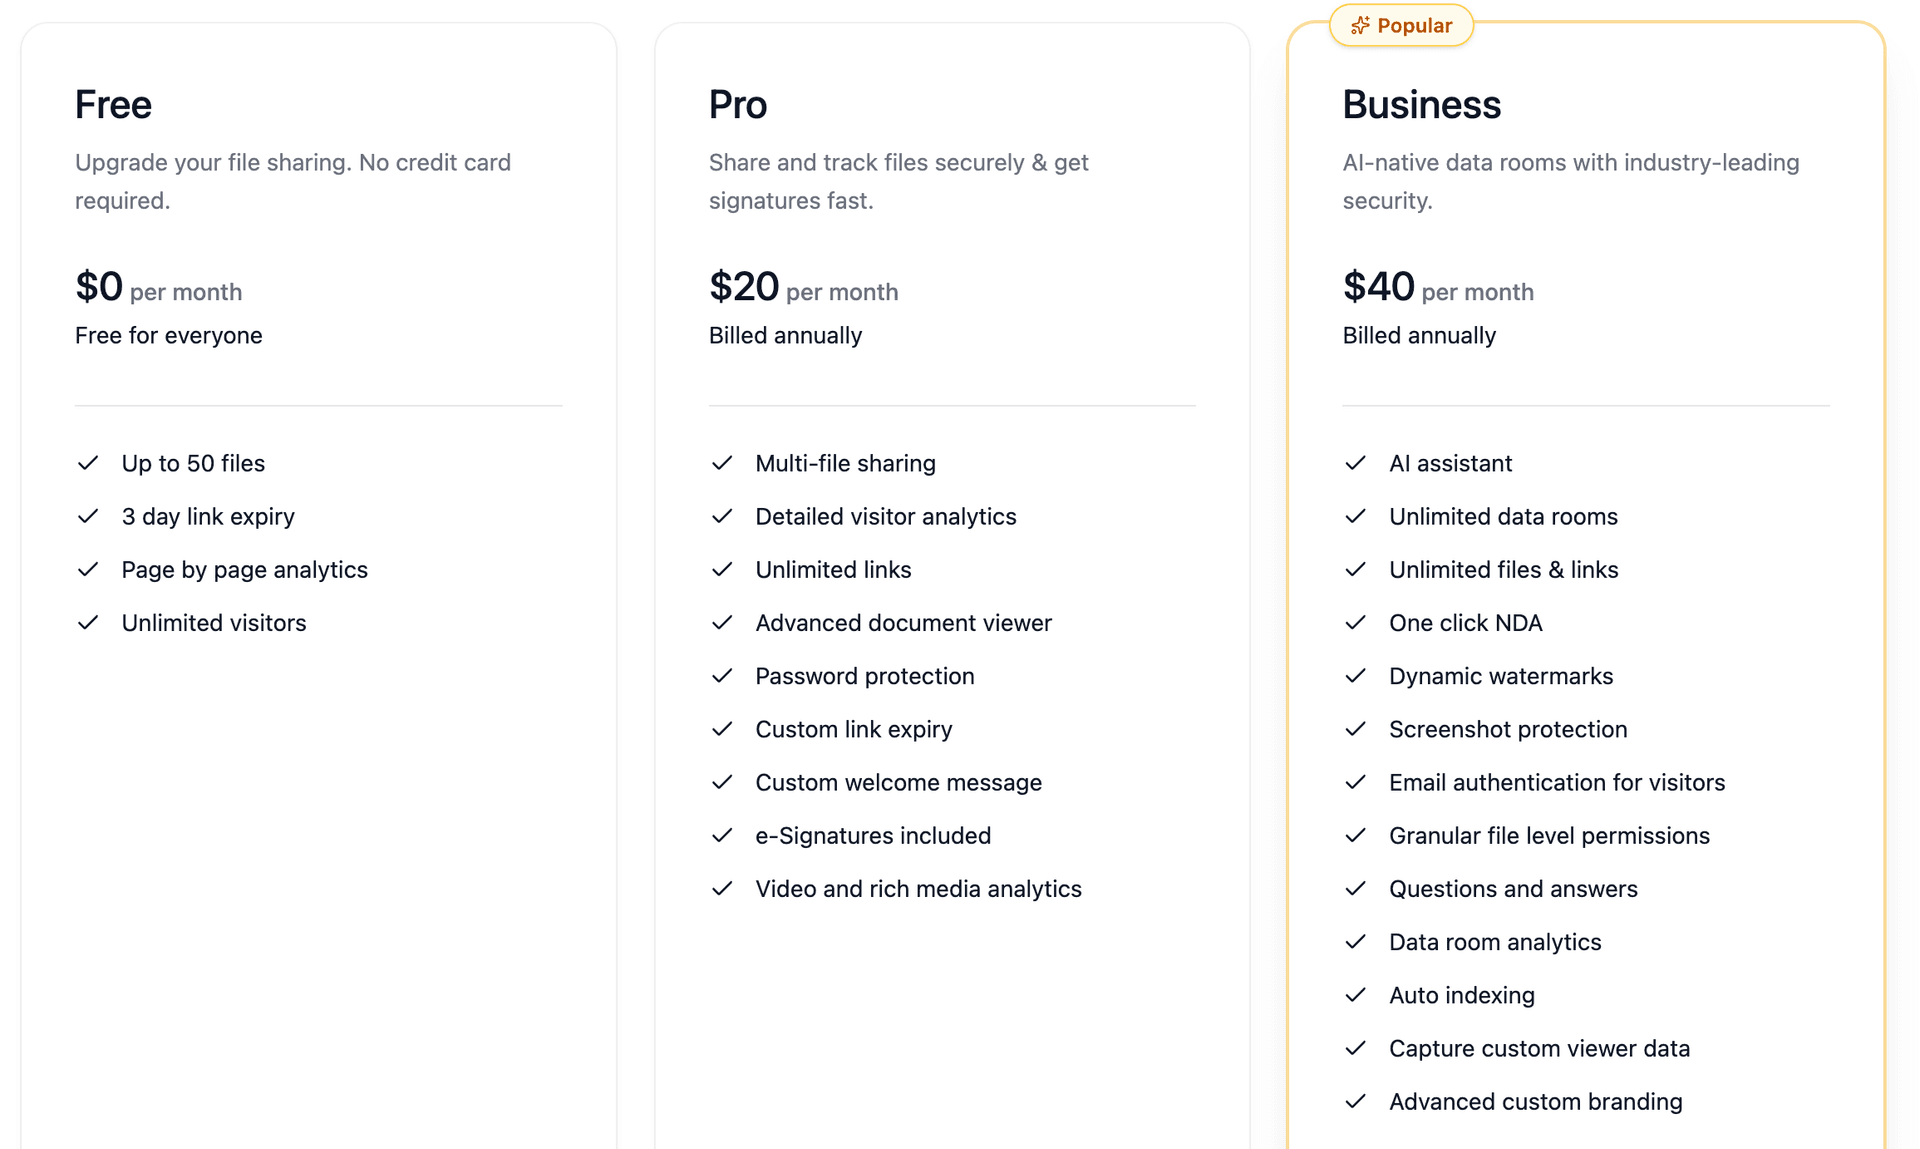
Peony starts free ($0, 2 GB). Pro is $20/admin/month and Business is $40/admin/month for unlimited data rooms with full analytics, e-signatures, and AI-powered organization. For a full guide on the sending process itself, see how to send your pitch deck to investors.
5 AI prompts that produce non-generic decks
These are the prompts I have seen produce the best results when paired with a truth document:
1. Narrative options
"Here is my truth document. Propose 3 different deck narratives, each with a 10-slide map and a one-sentence thesis. For each narrative, explain which investor profile it would resonate with most."
2. Slide job clarity
"For each slide in this deck, write: (a) what this slide must prove, (b) the strongest supporting evidence I should include, (c) what to remove."
3. Investor objection rehearsal
"Assume you are a skeptical seed investor who sees 1,000 decks per year. List the top 12 objections you would have after reading this deck, and suggest which slide should address each."
4. Copy tightening
"Rewrite these bullets to be shorter, more specific, and more credible. Preserve numbers exactly. Replace any adjective that could describe any company with a specific detail about this company."
5. Design direction
"Given this company and audience, suggest a simple design system: typography scale, spacing rules, and 3 layout patterns I should reuse across all slides."
The 5 most common AI pitch deck mistakes
I have reviewed AI-generated decks from founders raising pre-seed through Series B. The same mistakes appear repeatedly:
Mistake 1: It sounds like a template. The slides read like they could belong to any company in any industry. Fix: Add your real numbers, real customer language, and real constraints. If a sentence is interchangeable with a competitor's deck, rewrite it.
Mistake 2: Too many slides. AI tools default to generating more content than you need. Fix: Merge or delete anything that does not change an investor's decision. If removing a slide would not change the outcome of a partner meeting, remove it.
Mistake 3: Big claims, thin proof. AI confidently generates phrases like "massive market opportunity" with no supporting data. Fix: Add screenshots, benchmarks, or clearly-labeled assumptions. Every claim should have a source or a qualifier.
Mistake 4: Design noise. AI tools add gradients, decorative elements, and stock imagery that dilute your message. Fix: Remove decoration. Enforce a grid. White space is your friend.
Mistake 5: No storytelling arc. The slides present facts in sequence but do not build toward a conclusion. Fix: Choose your narrative in Step 2 and make sure every slide advances that specific story. The last slide before the Ask should make your raise feel inevitable.
AI pitch deck creation by the numbers
These are real, sourced figures — not fabricated benchmarks:
- 2-3 minutes — average time investors spend reviewing a pitch deck (DocSend Pitch Deck Benchmarks)
- 1,000+ — approximate number of pitch decks a typical VC fund receives per year, with fewer than 1% resulting in investment (Harvard Business School research)
- 10-15 slides — the sweet spot for initial pitch decks; engagement drops sharply beyond 20 slides
- $4.88 million — average cost of a data breach in 2024, with compromised credentials as the leading attack vector (IBM Cost of a Data Breach Report)
- 68% — percentage of data breaches involving a human element such as social engineering, errors, or misuse (Verizon 2024 Data Breach Investigations Report)
- 40%+ — percentage of email opens on mobile devices (Litmus Email Analytics), making poorly-rendered PDF attachments a real problem for deck delivery
That first number — 2-3 minutes — should shape everything. You are not building a document for deep study. You are building a summary that earns a meeting. AI helps you get there faster, but the human polish is what makes those 2-3 minutes count. With Peony analytics, you can see exactly how investors spend those minutes and optimize accordingly.
Practical tips for the AI-assisted fundraise
Start with the truth document, not the tool. The single biggest predictor of AI deck quality is input quality. Fifteen minutes writing your truth document saves hours of editing generic output.
Pick one narrative and commit. Decks that try to be both "mission-first" and "traction-first" end up being neither. Choose the story that matches your stage and stick with it.
Use AI for iteration, not just generation. After your first draft, paste specific slides back into AI with prompts like "make this slide more credible" or "cut this to half the words." AI is better at refining than generating from scratch.
Separate teaser from deep dive. Use a crisp 10-12 slide deck for initial outreach. Save the detailed financial model, product roadmap, and technical appendix for the data room stage when investors are doing due diligence. For guidance on setting up that room, our seed funding guide covers the full process.
Enable watermarks and screenshot protection by default. Dynamic watermarks — the viewer's email stamped on every page — do not prevent all leaks, but they make leaks attributable. That alone changes behavior.
Use personalized links for high-priority investors. Create individual links for your top targets so you get per-investor analytics and can revoke access individually. For batch outreach, a single link with email verification works fine.
Update the deck without resending. When you revise your financials or add a new traction data point, upload the new version to Peony. The same link automatically serves the updated deck. No version chaos, no v7_FINAL_FINAL.pdf.
Bottom line
AI has genuinely changed how fast you can go from "idea in my head" to "deck in an investor's hands." What used to take 40-80 hours and $2,000-5,000 in design fees now takes under 5 hours and costs close to nothing.
But the founders who raise successfully are not the ones who generate the fastest deck. They are the ones who:
- Direct AI with sharp inputs (truth document, narrative choice, slide map)
- Apply human judgment where it matters (proof, voice, taste, restraint)
- Share with intention (tracked links, per-page analytics, security controls)
Here is how that maps to your stage:
- Pre-seed, first deck ever — Use ChatGPT + Google Slides (free) for creation. Upload to Peony free tier for analytics and watermarks. Follow the 7-step workflow above.
- Seed round, warm intros, need signal — Use any AI tool you prefer for creation. Share through Peony Pro with personalized links for top investors.
- Series A+, multiple investors in parallel — Create with AI, share through Peony Business, and expand the same workspace into a full fundraising data room with e-signatures, NDA gates, and 2FA as due diligence begins.
Ready to share your AI-built deck like a founder who closes? Try Peony free — upload your deck, generate a trackable link, and see exactly which slides land.
FAQ
Can AI really create an investor-ready pitch deck?
AI can produce a strong first draft in a few hours, but you still need human polish. The best workflow is to use AI for structure, copy variations, and layout, then add your real traction numbers, authentic founder voice, and strategic nuance. Peony completes the loop by letting you share the finished deck as a trackable link with page-level analytics so you know which slides land.
What is the best free AI tool for creating a pitch deck?
ChatGPT (free tier) for content generation paired with Google Slides with Gemini for design gives you a zero-cost starting point. For sharing, Peony offers a free plan with per-page analytics, dynamic watermarks, and screenshot protection so you can track investor engagement without paying anything.
How many slides should an AI-generated pitch deck have?
Keep it to 10-15 slides. Investors spend 2-3 minutes on average (DocSend Pitch Deck Benchmarks) reviewing a deck, and engagement drops sharply after 20 slides. AI tools tend to over-generate, so your human polish pass should merge or delete anything that does not change a decision. With Peony analytics, you can see exactly where investors stop reading and trim accordingly.
How do I make an AI pitch deck not look generic?
Start with a truth document containing your real numbers, real customer language, and real constraints before touching AI. Feed that into AI for structure and copy, then replace every generic phrase with specifics: swap "fast growth" for "22% MoM for 6 months," swap "large market" for "$4.2B TAM growing 18% annually." Peony page-level analytics show you which slides investors actually engage with so you can double down on what resonates.
How do I securely share my AI-generated pitch deck with investors?
Upload your finished deck to Peony and share a single trackable link. Peony provides identity-bound access so only verified email addresses can view it, dynamic watermarks that stamp each viewer's identity on every page, screenshot protection, and link expiry. You can update the deck behind the same URL without resending and revoke access instantly if needed.
Can I track which slides investors actually read?
Yes. Peony provides page-level analytics showing exactly which slides each investor viewed, how long they spent on each page, and whether they returned for a second look. This data helps you identify which investors are genuinely engaged and when to follow up. Multiple views from the same firm often signal internal sharing ahead of a partner meeting.
What AI prompts work best for pitch deck content?
The most effective prompts are specific and structured. Start with a narrative options prompt that asks for three different deck storylines given your truth document. Follow with a slide job clarity prompt that defines what each slide must prove. Then use an investor objection prompt that lists the top objections a skeptical seed investor would have. Peony analytics later reveal which narrative approach resonates most with real investors.
How long does it take to create a pitch deck with AI?
With the 7-step workflow, expect about 4-5 hours total: 15 minutes for the truth document, 30 minutes for AI narrative options, 30 minutes for the slide map, 60-90 minutes for the AI first draft, 2-3 hours for human polish. Compare that to 40-80 hours for a fully manual deck. Once finished, upload to Peony in seconds and start sharing with tracked links immediately.
Should I use Tome, Beautiful.ai, or Gamma for my pitch deck?
Each tool has strengths: Gamma excels at turning outlines into complete slide drafts, Beautiful.ai auto-adjusts layouts as you type, and Tome generates narrative-driven presentations. Pick whichever matches your workflow, but remember that none of them solve the sharing problem. Upload the exported PDF to Peony for per-page analytics, dynamic watermarks, screenshot protection, and version control behind a single link.
What is the difference between an AI pitch deck tool and a data room?
AI deck tools help you create the presentation itself. A data room like Peony handles everything after creation: secure sharing, per-viewer analytics, access controls, watermarking, and document organization for due diligence. The best workflow is to build the deck with AI, then share it through Peony so you get tracking and security. As investors progress to diligence, the same Peony workspace expands into a full data room with financials, cap table, and legal documents.
Related Resources
- How to Send Your Pitch Deck to Investors
- How to Protect Your Pitch Deck
- How to Track Pitch Deck Engagement
- Seed Funding Guide
- Best Data Rooms for Startups
- DocSend Alternatives (Honest Review)
- Virtual Data Room Cost Guide
- Startup Due Diligence Guide
- Startup Fundraising Strategy
- Digital Sales Room Guide
- Peony Fundraising Solutions
- Peony for Startups
- Peony Pricing