
Q1 2026 Manufacturing Venture Benchmarks: $91B Pace, 56% AI-Enabled, $49B Defense Wave — and Why the Reshoring Lag Points to Q4

Co-founder at Peony. Former M&A at Nomura, early-stage VC at Backed VC, and growth-equity / secondaries investor at Target Global. I write about investors, fundraising, and deal advisors from the deal-side perspective I spent years in.
Q1 2026 Manufacturing Venture Benchmarks: $91B Pace, 56% AI-Enabled, $49B Defense Wave — and Why the Reshoring Lag Points to Q4
TL;DR: Q1 2026 was the most active manufacturing-venture quarter in history. ~$22B deployed (J.P. Morgan H1 2026 Startup Insights) — extrapolating to a $91B full-year pace versus $50B in 2025 and $25B in 2024. AI-enabled manufacturing startups crossed 56% of capital for the first time ever (up from 8% in 2015). Defense tech VC hit $49.1B in 2025 per PitchBook, +81% YoY — anchored by Anduril's $5B Series H at $61B valuation (CNBC, May 13 2026) and Saronic Technologies' $1.75B at $9.25B (CNBC, March 31 2026). The NY Fed GSCPI re-spiked to 1.82 in April 2026 (from 0.68 in March) — and JPM's 6-month-lag reshoring model (R²=0.55) predicts a second reshoring wave hitting Q4 2026 / Q1 2027, this time funded by private capital rather than CHIPS subsidy. For industrial M&A, CMMC Level 2 mandatory third-party assessments begin Nov 2026 — sellers without an ITAR/CMMC-compliant data room face 10-30% bid discounts.
Last updated: May 2026
Why I wrote this
I run Peony, a data room company. Across the 5,900-plus deal teams who have used Peony for fundraising, M&A, and investor reporting, we have started seeing a new pattern in 2026 — the industrial and defense deal teams are growing fastest, and the compliance bar for their data rooms is rising sharply. CMMC Level 2 enforcement begins for new Department of Defense contracts in November 2026, and ITAR-related deal-killer risks are surfacing weekly in our pipeline. The macro context is a manufacturing venture boom that has accelerated past the median observer's expectation.
This post is a deep-data benchmark report on what is actually happening in U.S. manufacturing venture and industrial M&A in Q1 2026. I have read the J.P. Morgan H1 2026 Startup Insights PDF, reconciled it against the PitchBook-NVCA Q1 2026 Venture Monitor and the companion Manufacturing the Arsenal note, the CB Insights Mega-Round Tracker, the Crunchbase Defense Tech 2025 Snapshot, the Reshoring Initiative 2024 Annual Report, and the NY Fed Global Supply Chain Pressure Index. I have layered eight proprietary frames Peony has developed from working with industrial and defense deal teams.
This post does not cover specific industrial verticals at depth (we have Best Data Room for Oil and Gas Companies for that vertical, and more capital-intensive verticals queued). Here I am answering one question: what does the current Q1 2026 data actually say about the U.S. manufacturing venture wave, and what does it mean for the founders, corp-dev teams, and capital allocators who are about to make decisions on the back of it?
How big is the 2026 manufacturing venture boom?
The headline numbers from J.P. Morgan's H1 2026 Startup Insights, cross-checked against PitchBook-NVCA and Crunchbase:
| Metric | 2024 | 2025 | Q1 2026 | 2026 pace |
|---|---|---|---|---|
| U.S. manufacturing venture capital | ~$25B | ~$50B | ~$22B | ~$91B |
| Total all-sector VC deal value (PitchBook) | n/a | n/a | $267.2B | record |
| Defense tech VC (PitchBook) | $27.2B | $49.1B | n/a (in flight) | continuing |
| Equity defense-tech funding (S&P) | $7.3B | $17.9B | n/a | n/a |
| Aerospace & defense VC | ~$10B | $29B | n/a | n/a |
| Mfg-focused defense deals (S&P) | n/a | $4.7B / 39 deals | n/a | n/a |
Three things stand out. First, the manufacturing slice has roughly doubled year-over-year for three consecutive years — $25B (2024), $50B (2025), $91B pace (2026). Second, the total VC market was record-breaking in Q1 2026 ($267.2B per PitchBook) but is heavily concentrated — PitchBook notes that excluding the top 5 deals, the figure falls 73.2%. Manufacturing benefited from this concentration; outside of Anthropic, xAI, OpenAI, Waymo, and Project Prometheus, the biggest checks went to physical-AI and defense names. Third, the 51.7% AI tag on Q1 megadeals (per PitchBook) overlaps heavily with manufacturing, robotics, and defense applications — the boundary between "AI company" and "physical-AI company" is now porous.
The named deals defining Q1 2026 give the abstract numbers texture:
- Anduril Industries raised a $5B Series H at $61B on May 13 2026, led by Thrive Capital with Andreessen Horowitz returning — doubling its $30.5B valuation from June 2025. 2025 revenue was $2.2B (2x 2024). Lifetime capital raised exceeds $11B. Use of proceeds: Arsenal-1, the high-rate manufacturing facility.
- Skild AI raised $1.4B at a $14B valuation in January 2026, led by SoftBank with NVIDIA NVentures, Macquarie, Bezos Expeditions, and Disruptive. Total raised since 2023 founding: $2B-plus across multiple rounds. Revenue went $0 → ~$30M in months during 2025. Skild Brain is a robotics foundation model that works across quadrupeds, humanoids, arms, and mobile manipulators.
- Saronic Technologies raised $1.75B at $9.25B on March 31 2026, led by Kleiner Perkins. The Austin-based autonomous-vessel maker has a $392M U.S. Navy contract and plans 20-plus ships per year by 2027 from Port Alpha, its next-generation shipyard.
- True Anomaly raised a $650M Series D at $2.2B on April 28 2026, co-led by Eclipse and Riot Ventures, for space-based interceptor and missile defense work tied to the Golden Dome program.
- Stoke Space extended its Series D to $860M total ($510M in October 2025, $350M extension in February 2026) at a $2B valuation. Launch Complex 14 at Cape Canaveral targeted for early 2026 activation.
- Apptronik raised $520M at ~$5B on February 11 2026, with returning investors Google, Mercedes-Benz, B Capital and new investors AT&T Ventures, John Deere, and Qatar Investment Authority. The Apollo humanoid is deploying in logistics and manufacturing.
- Hadrian Automation raised $260M Series C at $1.6B in July 2025 — AI-powered factories-as-a-service, opening a 350-job Mesa, AZ facility in early 2026.
- PsiQuantum raised $1B at $7B in September 2025, led by BlackRock, Temasek, and Baillie Gifford. Building utility-scale quantum sites in Brisbane and Chicago.
- Skydio raised a $110M Series F at $4.4B in April 2026 alongside a $3.5B five-year U.S. manufacturing pledge (Skyforge).
The pattern is consistent: defense and dual-use companies command the highest multiples, robotics foundation models are pricing like software companies, and U.S. manufacturing capex (Hadrian Mesa, Anduril Arsenal-1, Skydio Skyforge) is now a major component of how rounds are deployed — not just R&D.
Why has AI-enabled manufacturing crossed half of all capital?
The AI-enabled share trajectory in U.S. manufacturing venture, per J.P. Morgan H1 2026:
| Year | AI-enabled share of mfg VC |
|---|---|
| 2015 | 8% |
| 2017 | 18% |
| 2020 | 21% |
| 2022 | 28% |
| 2024 | 34% |
| 2025 | 45% |
| Q1 2026 | 56% |
The acceleration in 2025 (45%) and Q1 2026 (56%) reflects a real production shift, not just deck tagging. KPMG's 2026 Industrial Manufacturing Tech Report finds 49% of industrial executives report active AI use cases delivering business value, with 68% expecting scaled deployment within 12 months. PitchBook's Mapping the AI Super-Cycle note calls Q1 2026 the pivot quarter from pilot AI to full-scale agentic deployments.
CB Insights' Mega-Round Tracker (November 2025) reported $7.7B in Q4 2025 mega-rounds tagged to "physical AI" — manufacturing, robotics, and defense applications, excluding Anthropic. The 8 mega-rounds in the bucket totaled $7.7B and the quote was straightforward: "Next phase of AI is physical."
The factory-side adoption is uneven, however. J.P. Morgan's survey of factory readiness:
| Factory automation level | % of factories | AI adoption % within tier |
|---|---|---|
| Legacy (no automation) | 35% | 5% |
| Partially automated | 40% | 25% |
| Connected (IoT/Edge) | 18% | 55% |
| Fully digital (AI-native) | 7% | 90% |
Only 7% of factories are fully digital, but 90% of that 7% have deployed at least one production-facing AI use case. The market is bifurcating sharply — a small leading cohort moves first and fast, a long tail moves slowly or not at all. Industrial AI ROI benchmarks from Microsoft's Manufacturing Cloud team reinforce why leaders pull away: 250-300% ROI on predictive maintenance, 99.8% quality inspection accuracy with AI vision, 25-40% maintenance cost reduction, and McKinsey-cited 20-30% productivity gains with 50% downtime reduction.
Proprietary frame: AI-Ready Capability Tax
Moving a factory from "connected" (IoT/Edge, ~18% of plants) to "fully digital" (AI-native, ~7% of plants) costs 3-5 times what factories budget on first pass. The gap is buried in data infrastructure, model ops, and quality re-tooling — not robots. Robots are visible capex; AI requires invisible foundation (data lakehouse, MES integration, sensor standardization, model governance). McKinsey and Deloitte benchmarks consistently show data infrastructure as 60-70% of true AI program cost. Decision rule: underwrite digital-factory transitions with 3.5 times the vendor-quoted budget. If management cannot articulate where the data lakehouse and MES integration spend is, the project will overrun.
The implication for capital deployers: AI-enabled startups are taking the marginal manufacturing dollar because they unlock the data foundation that legacy and partially-automated plants cannot. The 35% of factories still in the legacy band are a structurally addressable but capital-hungry tail. The startups that can sell into the 58% of plants in the partial-to-connected middle band — bridging them to the next automation tier — are pricing at premium multiples.
What does the reshoring 6-month lag predict for Q4 2026?
The most narrative-shifting piece of fresh data in the entire Q1 2026 dataset is the April 2026 NY Fed Global Supply Chain Pressure Index reading. After a long unwind from the Q1 2022 peak of 4.0-plus, the GSCPI sat at 0.68 in March 2026 — close to historical normal. The April reading was 1.82, a sharp reversal driven by Red Sea shipping disruption, port labor issues, and a tariff-action wave.
J.P. Morgan's reshoring index data establishes the historical relationship: headline reshoring activity in any quarter Q is best explained by GSCPI in Q minus 2 (a roughly 6-month lag), with an R-squared of 55%. The mechanism is institutional — reshoring decisions require board approval, site selection, incentive negotiations, and federal program applications, none of which happen in 90 days.
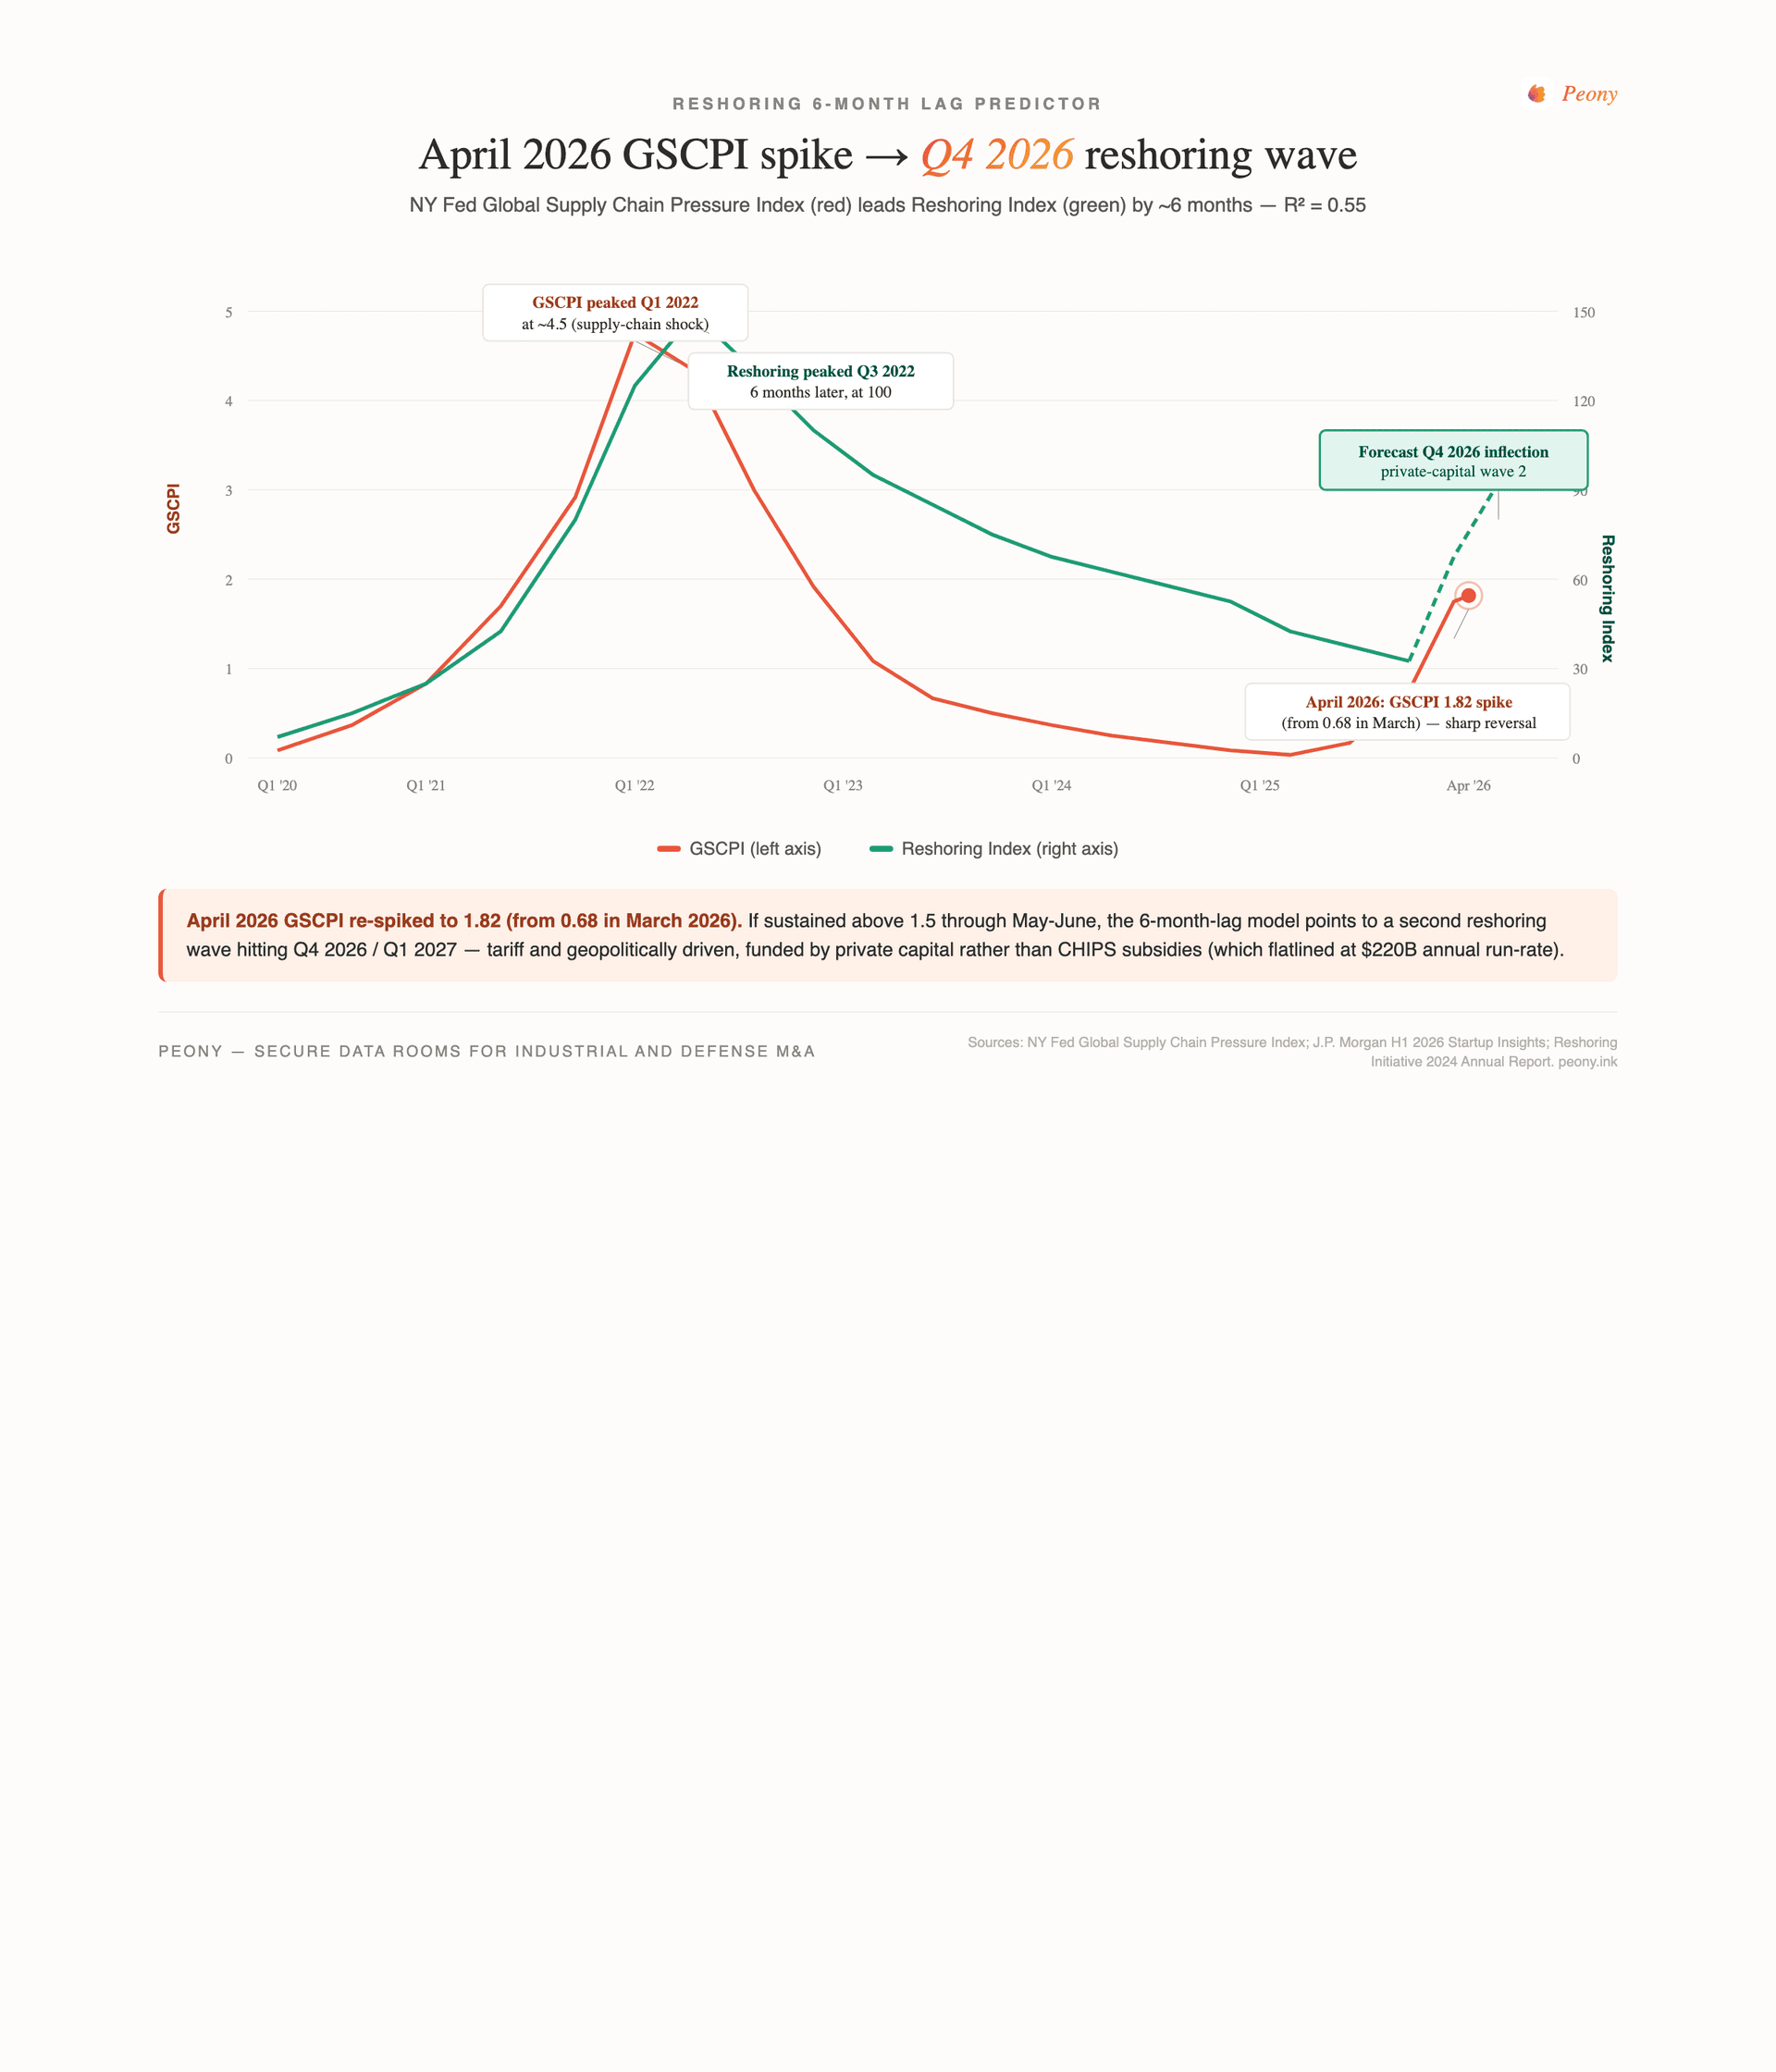
Plotting the relationship:
| Period | GSCPI | Reshoring index (6 mo. later) |
|---|---|---|
| Q1 2020 | ~0.5 | 28 (Q3 2020) |
| Q1 2022 | 4.0+ (peak) | 100 (Q3 2022 peak) |
| Q1 2023 | ~1.0 | 80 (Q3 2023) |
| Q3 2024 | ~0.4 | 60 (Q1 2025, declining) |
| April 2026 | 1.82 (re-spike) | Q4 2026 forecast: re-acceleration |
The April spike implies that, if sustained through May and June, the reshoring index re-accelerates into Q4 2026 and Q1 2027. The composition of the second wave will be different from the first. The first wave (2022-2024) was CHIPS- and IRA-driven — federal manufacturing incentives went $75B (H1 2020) → $115B (H1 2022) → $230B (H1 2024 peak). The Reshoring Initiative reports 244,000 jobs announced via reshoring and FDI in 2024, with 88% in high or medium-high tech sectors and 67% in semiconductors, EV batteries, and solar — the CHIPS-IRA target sectors.
But the first wave has already peaked. The Reshoring Initiative's early 2025 data shows Electrical Equipment jobs DOWN 54% YoY and Computer & Electronics DOWN 20% YoY. Federal incentives have flatlined at $220B annual run-rate. Marginal subsidy dollars cannot move the marginal facility because the binding constraint has shifted from capital to labor (workforce gap: 67,000 semiconductor jobs at risk of being unfilled by 2030, per ITIF).
Proprietary frame: Reshoring 6-Month Lag
Supply-chain shock events (Suez closures, port strikes, tariff actions, GSCPI spikes) trigger reshoring announcements with a roughly 6-month delay, not immediately. R-squared of 55% from JPM data shows headline reshoring activity in any quarter is best explained by GSCPI two quarters prior. The mechanism is institutional — reshoring decisions require board approval, site selection, incentive negotiations, and federal program applications, none of which happen in 90 days. Decision rule: if GSCPI sustains above 1.5 for two consecutive quarters, allocate to onshoring-exposed equities and pre-position VDR capacity for the M&A wave that follows.
Proprietary frame: Subsidy Cliff & Second-Wave Catalyst
Subsidy-led reshoring (CHIPS, IRA) peaked in 2023-2024. Early 2025 data shows Electrical Equipment jobs DOWN 54% and Computer & Electronics DOWN 20%. The reshoring trade is bifurcating into "post-subsidy private-capital reshoring" (tariff- and geopolitically-driven) versus "stalled CHIPS-dependent reshoring." The Trump administration's CHIPS Office review (March 2025 EO establishing the Investment Accelerator) accelerates this bifurcation but cannot reverse the iron-clad contracts already signed. Decision rule: from mid-2026 onward, separate "policy reshoring" from "tariff/geopolitical reshoring." The second wave will be PE-funded and venture-funded, not CHIPS-funded.
Why are import-reliant sectors the biggest capex multiplier?
J.P. Morgan's H1 2026 chart relating 2019 import-reliance to 2020-2025 capex surge produces one of the cleanest empirical relationships in the entire report. Sectors with the highest pre-2020 import reliance saw the largest capex surges:
| Sector | 2019 import reliance (%) | 2020-2025 capex surge (%) |
|---|---|---|
| Batteries | 90%+ | ~225% |
| Semiconductors | 85% | ~190% |
| Pharma | 75% | ~150% |
| Electronics | 65% | ~115% |
| Biotech | 55% | ~85% |
| Auto parts | 45% | ~80% |
| Machinery | 35% | ~40% |
| Steel | 25% | ~30% |
The fit approaches R² = 0.85. Strategic vulnerability triggers disproportionate policy response (CHIPS, IRA, defense procurement) and corporate insurance spend. Risk-weighted capex tracks risk-weighted import dependency.
The named buildouts illustrate where the dollars are flowing. TSMC Arizona's total commitment is now $165B — Fab 21 Phase 1 is operational producing Apple chips and NVIDIA Blackwell AI processors, and Fab 21 Phase 2 construction is complete with equipment install in Q3 2026. Samsung's Taylor, TX facility resumed construction in mid-2025 after a pause and is considering an upgrade from 4nm to 2nm node tech. Intel's 18A process went online in Arizona in early 2026 (though the Ohio fab project has been multi-year delayed). On the battery side, Ford BlueOval Battery Park in Marshall, MI is a $2.5B LFP plant; Stellantis announced $13B, the largest U.S. investment in company history; and NextStar Energy in Windsor, ON is the C$5B-plus JV that Stellantis recently sold its 49% stake of to LG Energy Solution.
Proprietary frame: Import-Reliance Capex Multiplier
A sector's 2020-2025 capex surge scales non-linearly with its starting import-reliance ratio. Sectors with greater than 75% import reliance saw 150-225% capex surges; 50-75% saw 80-150%; under 50% saw under 50% surge. The R-squared approaches 0.85. Strategic vulnerability triggers disproportionate policy response and corporate insurance spend. Decision rule: prioritize verticals where import-reliance was greater than 65% pre-2020 — these have the longest tail of capex still to deploy through 2027-2028 (because facility construction lags capex commit by 18-30 months).
Why are most factories not actually AI-ready?
J.P. Morgan's factory readiness breakdown is a sobering reality check on the AI manufacturing narrative. Only 7% of U.S. factories are fully digital and AI-native. Another 18% are connected (IoT/Edge) but not yet running production AI at scale. 75% of factories sit in the legacy or partially-automated tier, where AI adoption ranges from 5% to 25% — mostly point solutions, not integrated systems.
The smart factory adoption baseline globally is rising: Autonex Control's 2026 industry report puts global smart manufacturing adoption at 47% in early 2026, up 12 percentage points YoY. Within that adoption: 41% are prioritizing factory automation hardware, 34% active sensors, 28% vision systems. AI yields a 31% average efficiency gain, 43% unplanned downtime reduction, and digital twin commissioning reduces installation time by 52% (6-8 weeks on large projects). Over 4,200 facilities reported digital twin deployments in 2025.
But the gap between adoption and full AI-readiness is large. KPMG's 49% / 68% (active value / planned scale) is encouraging at the survey level, but PitchBook's "pivot quarter" framing implies most enterprise AI deployments in manufacturing are still in pilot. The AI-enabled venture share (56% of capital) is racing ahead of factory readiness because investors are funding the future readiness, not the current state.
The implication for industrial founders: selling into the 75% of legacy and partially-automated plants requires offering a ladder — point solutions that improve quality or throughput by 10-20% in 90 days, with a roadmap to integrated AI in 18-24 months. Selling a moonshot to a legacy factory wastes everyone's cycle.
How fast are robot costs falling versus human compensation?
The most striking single chart in J.P. Morgan's H1 2026 deck is the robot-to-human cost ratio. Robot effective cost has fallen roughly 70% in 14 years (2010-2024), while U.S. employer compensation costs rose modestly each year. The result:
| Year | Robot effective cost (amortized $/yr) | Human/robot cost ratio |
|---|---|---|
| 2010 | $7,500 | 4.8x |
| 2012 | $6,200 | 6.0x |
| 2014 | $5,100 | 7.5x |
| 2016 | $4,300 | 9.1x |
| 2018 | $3,800 | 10.8x |
| 2020 | $3,200 | 13.4x |
| 2022 | $2,700 | 16.3x |
| 2024 | $2,300 | 20.0x |
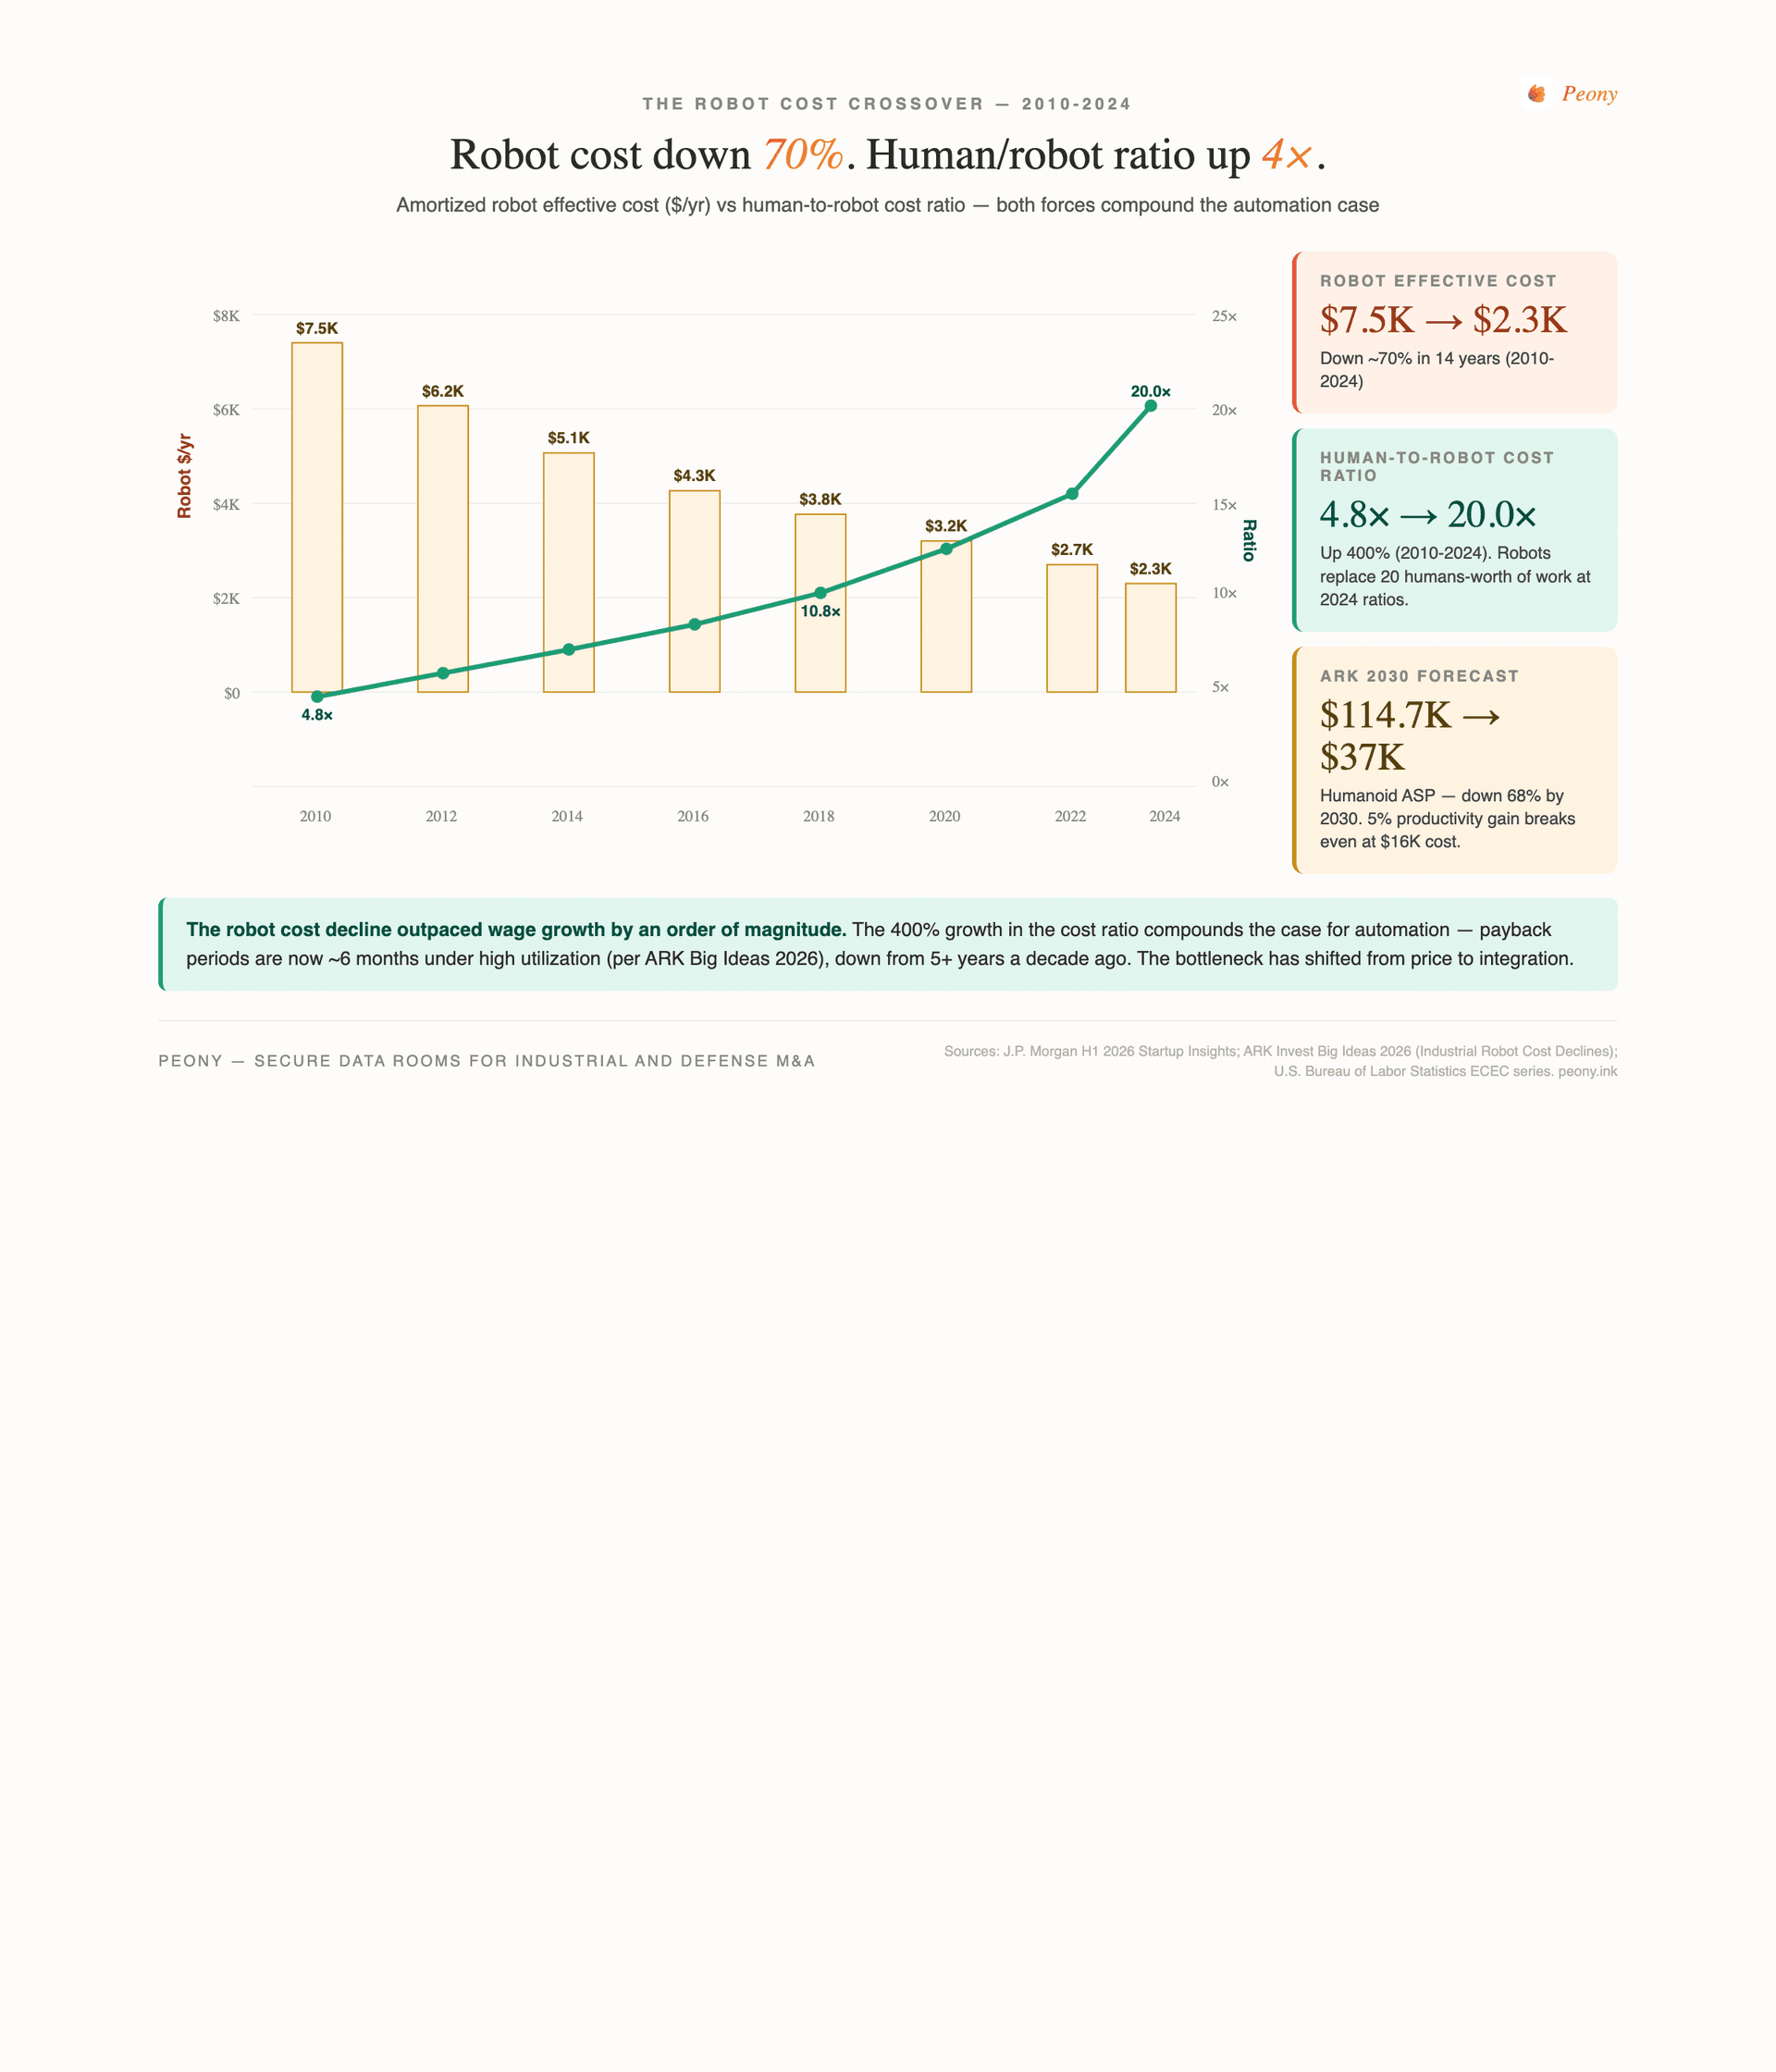
The 400% growth in the cost ratio compounds the case for automation. ARK Invest's Big Ideas 2026 humanoid robotics chapter projects average selling price will fall from $114,700 in 2024 to roughly $37,000 by 2030 — a ~68% drop in six years. Entry-level 2026 units (Unitree G1, Tesla Optimus targets) are at $13,500 to $30,000. ARK's payback math: ~6 months under high utilization, ~15 months under medium. The threshold for breakeven is striking — at $16,000 robot cost, a humanoid only needs ~5% productivity gain versus a human worker to break even.
Counter-claim worth flagging: BOM analysis from Goldman Sachs and Morgan Stanley still puts unit BOM in the $50,000-$80,000 range for current humanoids. Sub-$30,000 ASPs assume massive subsidization or fleet-utilization-driven robotics-as-a-service pricing, not direct-sale economics. The cost trajectory is real but the unit economics for first-generation deployments still depend on RaaS models, not direct ownership.
Where is applied robotics capital concentrating in 2026?
The applied robotics venture ecosystem in 2025 (J.P. Morgan H1 2026):
| Category | 2025 capital ($B) | Share of deals | Share of dollars | Quadrant |
|---|---|---|---|---|
| Autonomous robotic systems | $4.3B | 45% | 45% | Scaled winners |
| Collaborative robots (cobots) | $4.2B | 20% | 35% | Concentrated attention |
| Humanoids | $3.0B | 8% | 25% | Concentrated attention |
| Delivery robots / drones | $0.86B | 7% | 7% | Niche |
| Specialty robotics | $0.52B | 12% | 5% | Emerging |
| Industrial robotics | $0.21B | 5% | 3% | Stable |
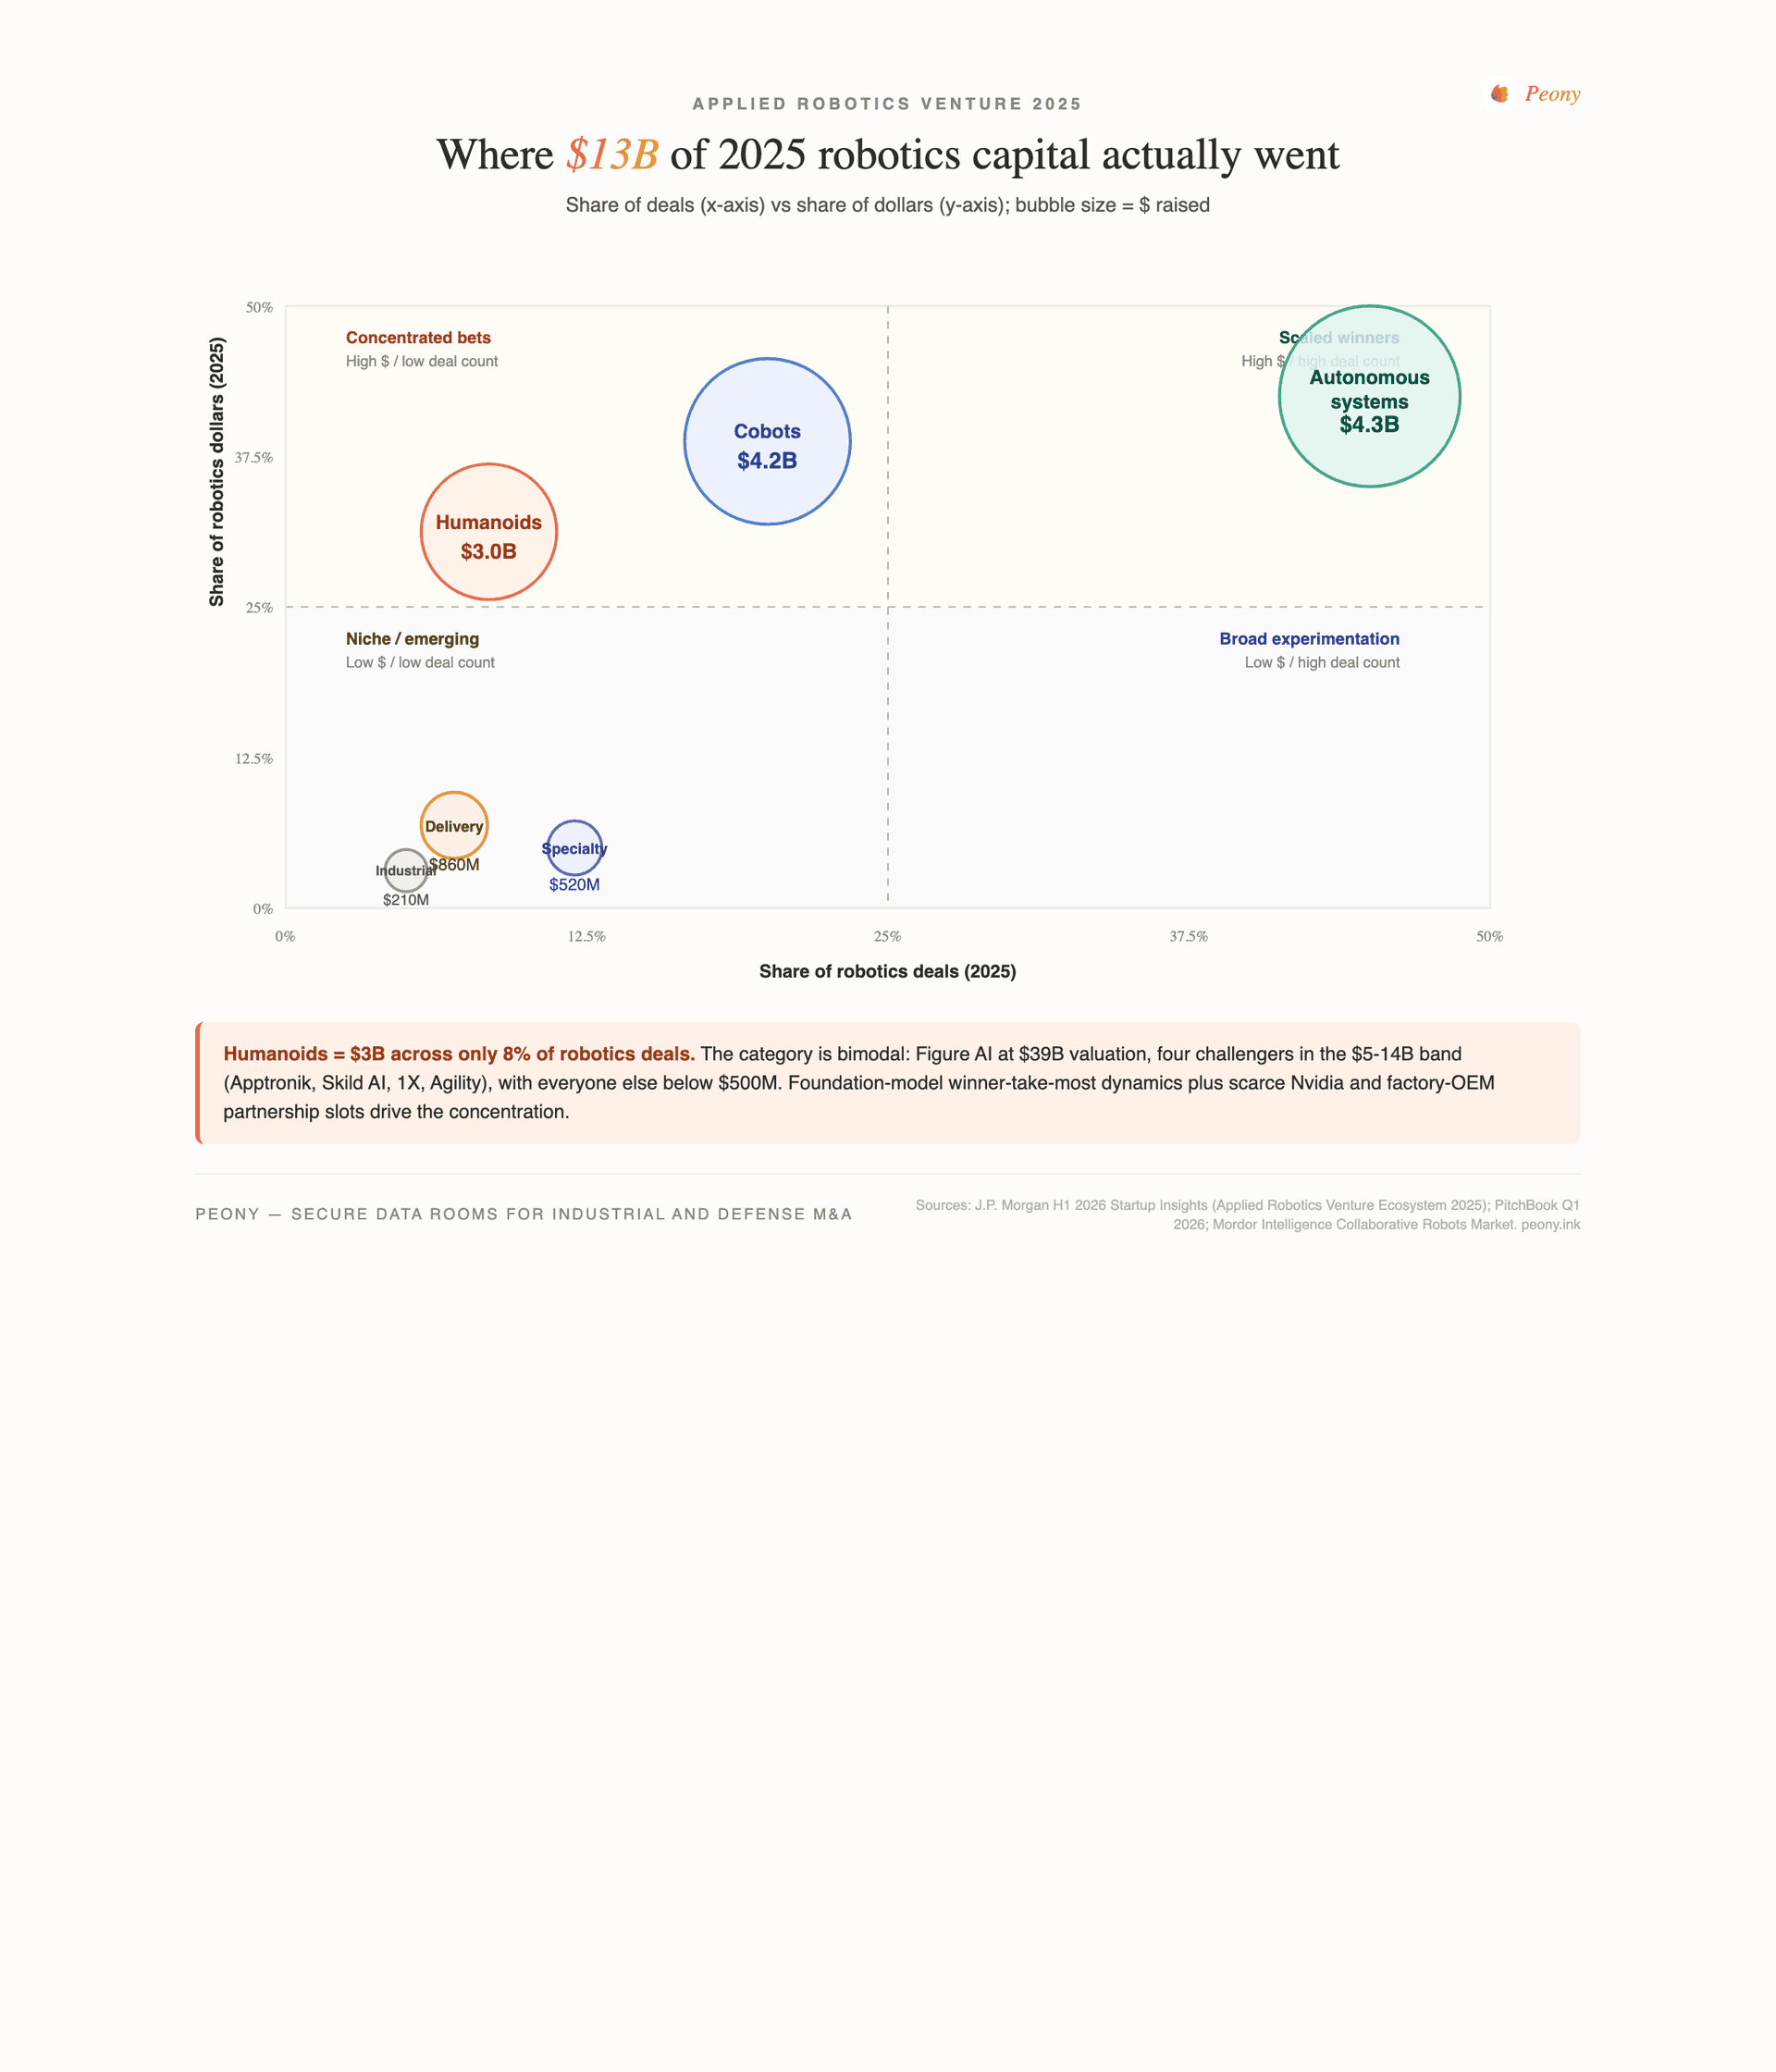
Total: roughly $13B in applied robotics venture in 2025. Three categories — autonomous systems, cobots, and humanoids — captured 85% of the dollars. The applied robotics index (indexed to 2015 = 100) peaked at roughly 450 in 2021, currently sits at ~330 in 2025. "All other robotics" venture is at ~220, growing more steadily.
The cobot market is the most mature commercially. Global cobot TAM is $1.9B (2025) growing to roughly $2.3-2.8B in 2026 and $5.7-13.3B by 2031-2034. North America is the fastest-growing region with a 26% CAGR (2026-2031). Mordor Intelligence tracks Universal Robots at ~38-39% market share with 100,000-plus units sold globally, ABB at ~19%, and the top three (UR, ABB, FANUC) accounting for ~45% of unit shipments combined.
Autonomous robotic systems are the scaled-winners quadrant, dominated by warehouse and fulfillment leaders. Symbotic completed its $200M (up to $450M with milestone earnouts) acquisition of Walmart's Advanced Systems & Robotics business in January 2025, signaling early consolidation of the robotics-as-a-service stack; Symbotic's backlog has since grown past $5B and the company acquired Fox Robotics (autonomous forklifts) in March 2026. Amazon has deployed more than 1 million robots across its operations, with Vulcan — the first robot with a sense of touch — picking and stowing roughly 75% of stored item types at human-comparable speed.
Humanoids are the concentrated-attention quadrant. Despite getting only 8% of robotics deal count, humanoids commanded 25% of robotics dollars in 2025. The cap stack is bimodal in a way no other robotics category is.
Why are humanoid robots a bimodal market?
Humanoid robotics venture activity in 2025-2026 totaled roughly $3B but went to fewer than 8% of robotics deals. The cap stack:
| Company | Valuation | Lifetime capital | Notes |
|---|---|---|---|
| Figure AI | $39B | $1.5B+ | Series C Sep 2025 — Parkway-led; Brookfield, Intel, Macquarie, Nvidia, Qualcomm, Salesforce, T-Mobile. Plans 100,000 humanoids in 4 years. |
| Skild AI | $14B | $2B+ | Foundation model platform; January 2026 round — SoftBank-led with Nvidia NVentures, Bezos Expeditions. |
| Apptronik | $5B | $935M | Series A-X extension Feb 2026 — Google, Mercedes-Benz, B Capital returning; AT&T Ventures, John Deere, QIA new. |
| 1X Technologies | n/a (opaque) | n/a | Commercial 10,000-unit EQT deal anchored; California factory targeting 100,000 humanoids by 2027; Neo consumer launch at $20K USD. |
| Agility Robotics | n/a | n/a | Digit deployed at GXO + SPANX — industry-first multi-year humanoid agreement; >100,000 totes moved as of Nov 2025. |
| Physical Intelligence | n/a | $600M | Late 2025 — general-purpose AI software for any robot/physical task. |
| Everyone else | under $3B | under $200M | Long tail with no clear winners |
A single leader at $39B post-money, four challengers in the $5-14B range, and everyone else dropping below $500M. There is no middle market. Foundation-model-style winner-take-most dynamics, plus scarce factory partnerships (Mercedes-Benz, Toyota, Hyundai, BMW, Foxconn, Nvidia partnership slots are finite), drive the concentration.
The Tesla Optimus deployment is a separate vector. Tesla reported 1,000-plus Optimus Gen 3 units across its factories as of January 2026, and is targeting 10 million units per year capacity buildout at the Texas plant by 2027. 2026 annual production guidance ranges from 50K to 1M units — a wide band that reflects Tesla's history of revised-down guidance. Boston Dynamics Atlas unveiled its production version at CES January 2026, with all 2026 deployments already reserved (initial customers: Hyundai and Google DeepMind; Hyundai planning a 30,000-units-per-year dedicated robotics factory by 2028). Foxconn is deploying humanoid robots on production lines at its Houston, TX AI server plant (powered by NVIDIA Isaac GR00T N model), with Foxconn Vietnam trials in September 2026 and official production in November 2026.
Proprietary frame: Humanoid Capital Concentration Curve
2025 humanoid venture activity = ~$3B but went to less than 8% of deals. The cap stack is bimodal: a single $39B-valued leader (Figure) and four $5-14B challengers (Apptronik, Skild AI, 1X, Agility), with everyone else dropping below $500M. There is no middle market. Drivers: foundation-model-style winner-take-most dynamics, scarce Nvidia partnership slots, scarce factory partnership slots (Mercedes/Toyota/Hyundai/BMW are finite). Decision rule: outside the top 5 humanoid platforms plus the top 2 foundation models (Skild AI, Physical Intelligence), assume zero terminal value unless paired with vertically-integrated production (Tesla, Hyundai, or Foxconn-class).
What does the defense founder surge mean for manufacturing M&A?
The single largest sector pivot in modern manufacturing entrepreneurship is the defense surge. Per J.P. Morgan H1 2026 founder-focus data:
| Sector | 2015-2019 founder cohort | 2020-2025 founder cohort | Delta (pp) |
|---|---|---|---|
| Aerospace & defense | 5.1% | 8.3% | +3.2 |
| Renewable / sustainable energy | n/a | n/a | +2.2 |
| Robotics & AI for industrial use | n/a | n/a | +1.7 |
| Electric & sustainable mobility | n/a | n/a | +1.4 |
| Battery & energy storage | n/a | n/a | +1.0 |
| Semiconductors & photonics | n/a | n/a | +0.3 |
| Construction materials & tech | n/a | n/a | -0.1 |
| Sustainable environmental | n/a | n/a | -0.3 |
| Personal care & beauty | n/a | n/a | -0.3 |
| Additive manufacturing / 3D printing | n/a | n/a | -0.9 |
| Food & wellness | n/a | n/a | -1.0 |
| Beverage manufacturing | n/a | n/a | -1.0 |
| Medical devices & health tech | n/a | n/a | -1.2 |
| Diversified product manufacturing | n/a | n/a | -2.0 |
| Sensors & tech solutions | n/a | n/a | -2.9 |
Aerospace and defense as percentage of founder focus jumped from 5.1% to 8.3% — a 63% relative increase in five years. Defense was the largest single pivot.
The drivers behind the surge: Anduril's $61B valuation makes defense a credible founder path with a clear exit ramp; Palmer Luckey's SHIELD contract vehicle (10-year, $151B ceiling, 2,100+ orgs, 19 work areas) opened federal procurement to startups at scale; Trae Stephens and Founders Fund built celebrity-grade visibility around the defense thesis; a16z's American Dynamism fund ($1.18B dedicated within the firm's $15B January 2026 raise) signaled LP-grade commitment; and Replicator and Office of Strategic Capital programs reduced founder coordination cost. Add an LP cycle that no longer treats defense as ESG-excluded, and the structural barriers fell at the same time.
The numbers behind the surge are large. Per PitchBook and S&P Global Market Intelligence:
- Total defense tech VC 2025: $49.1B (vs $27.2B in 2024 — +81% YoY)
- Equity defense-tech funding: $17.9B (2025) vs $7.3B (2024) — 2.5x
- Manufacturing-focused defense: $4.7B across 39 deals (~2x YoY)
- Aerospace & defense VC: $29B in 2025 — nearly 3x 2020
- General-purpose robotics: $3.2B across 2024-2025 — 8 companies, defense-adjacent
- Palantir Army deal: $10B over 10 years — consolidates 75 contracts into 1
- SHIELD contract vehicle: $151B over 10 years
Concentration warning: Anduril alone is ~10% of 2025 defense VC. The top 5 defense names — Anduril, Shield AI, Saronic, Skild AI, True Anomaly — account for more than 50% of dollars. The healthy-ecosystem narrative is partly real (many emerging defense names), partly a story of consolidation around foundation-platform plays.
Proprietary frame: Defense Founder Surge (5.1 → 8.3)
Aerospace and defense as percentage of new manufacturing startup founder focus jumped from 5.1% (2015-2019 cohort) to 8.3% (2020-2025 cohort) — a 63% relative increase. This is the largest sector pivot in modern manufacturing entrepreneurship. Drivers: Anduril's $61B valuation, Palmer Luckey's SHIELD vehicle, Trae Stephens/Founders Fund visibility, a16z American Dynamism fund ($1.18B dedicated), Replicator and Office of Strategic Capital programs, and an LP cycle that no longer ESG-excludes defense. Decision rule: for sector M&A heatmaps, aerospace and defense subsectors will see the highest deal volume per founded company through 2028. CMMC-compliant data rooms become a contested requirement.
How does automation share compound on quality outcomes?
The European Manufacturing Survey 2022 cohort analysis of 476 firms (coordinated by Fraunhofer ISI) is the cleanest empirical work on automation-share-to-quality outcomes. J.P. Morgan H1 2026 reproduces the headline data:
| Automation share band | Defect rate | Scrap rate | Rework rate |
|---|---|---|---|
| 0-10% | 4.8% | 8.2% | 12.0% |
| 10-25% | 3.2% | 5.5% | 8.0% |
| 25-50% | 1.8% | 3.1% | 4.5% |
| 50-75% | 0.9% | 1.5% | 2.2% |
| 75-100% | 0.3% | 0.6% | 0.8% |
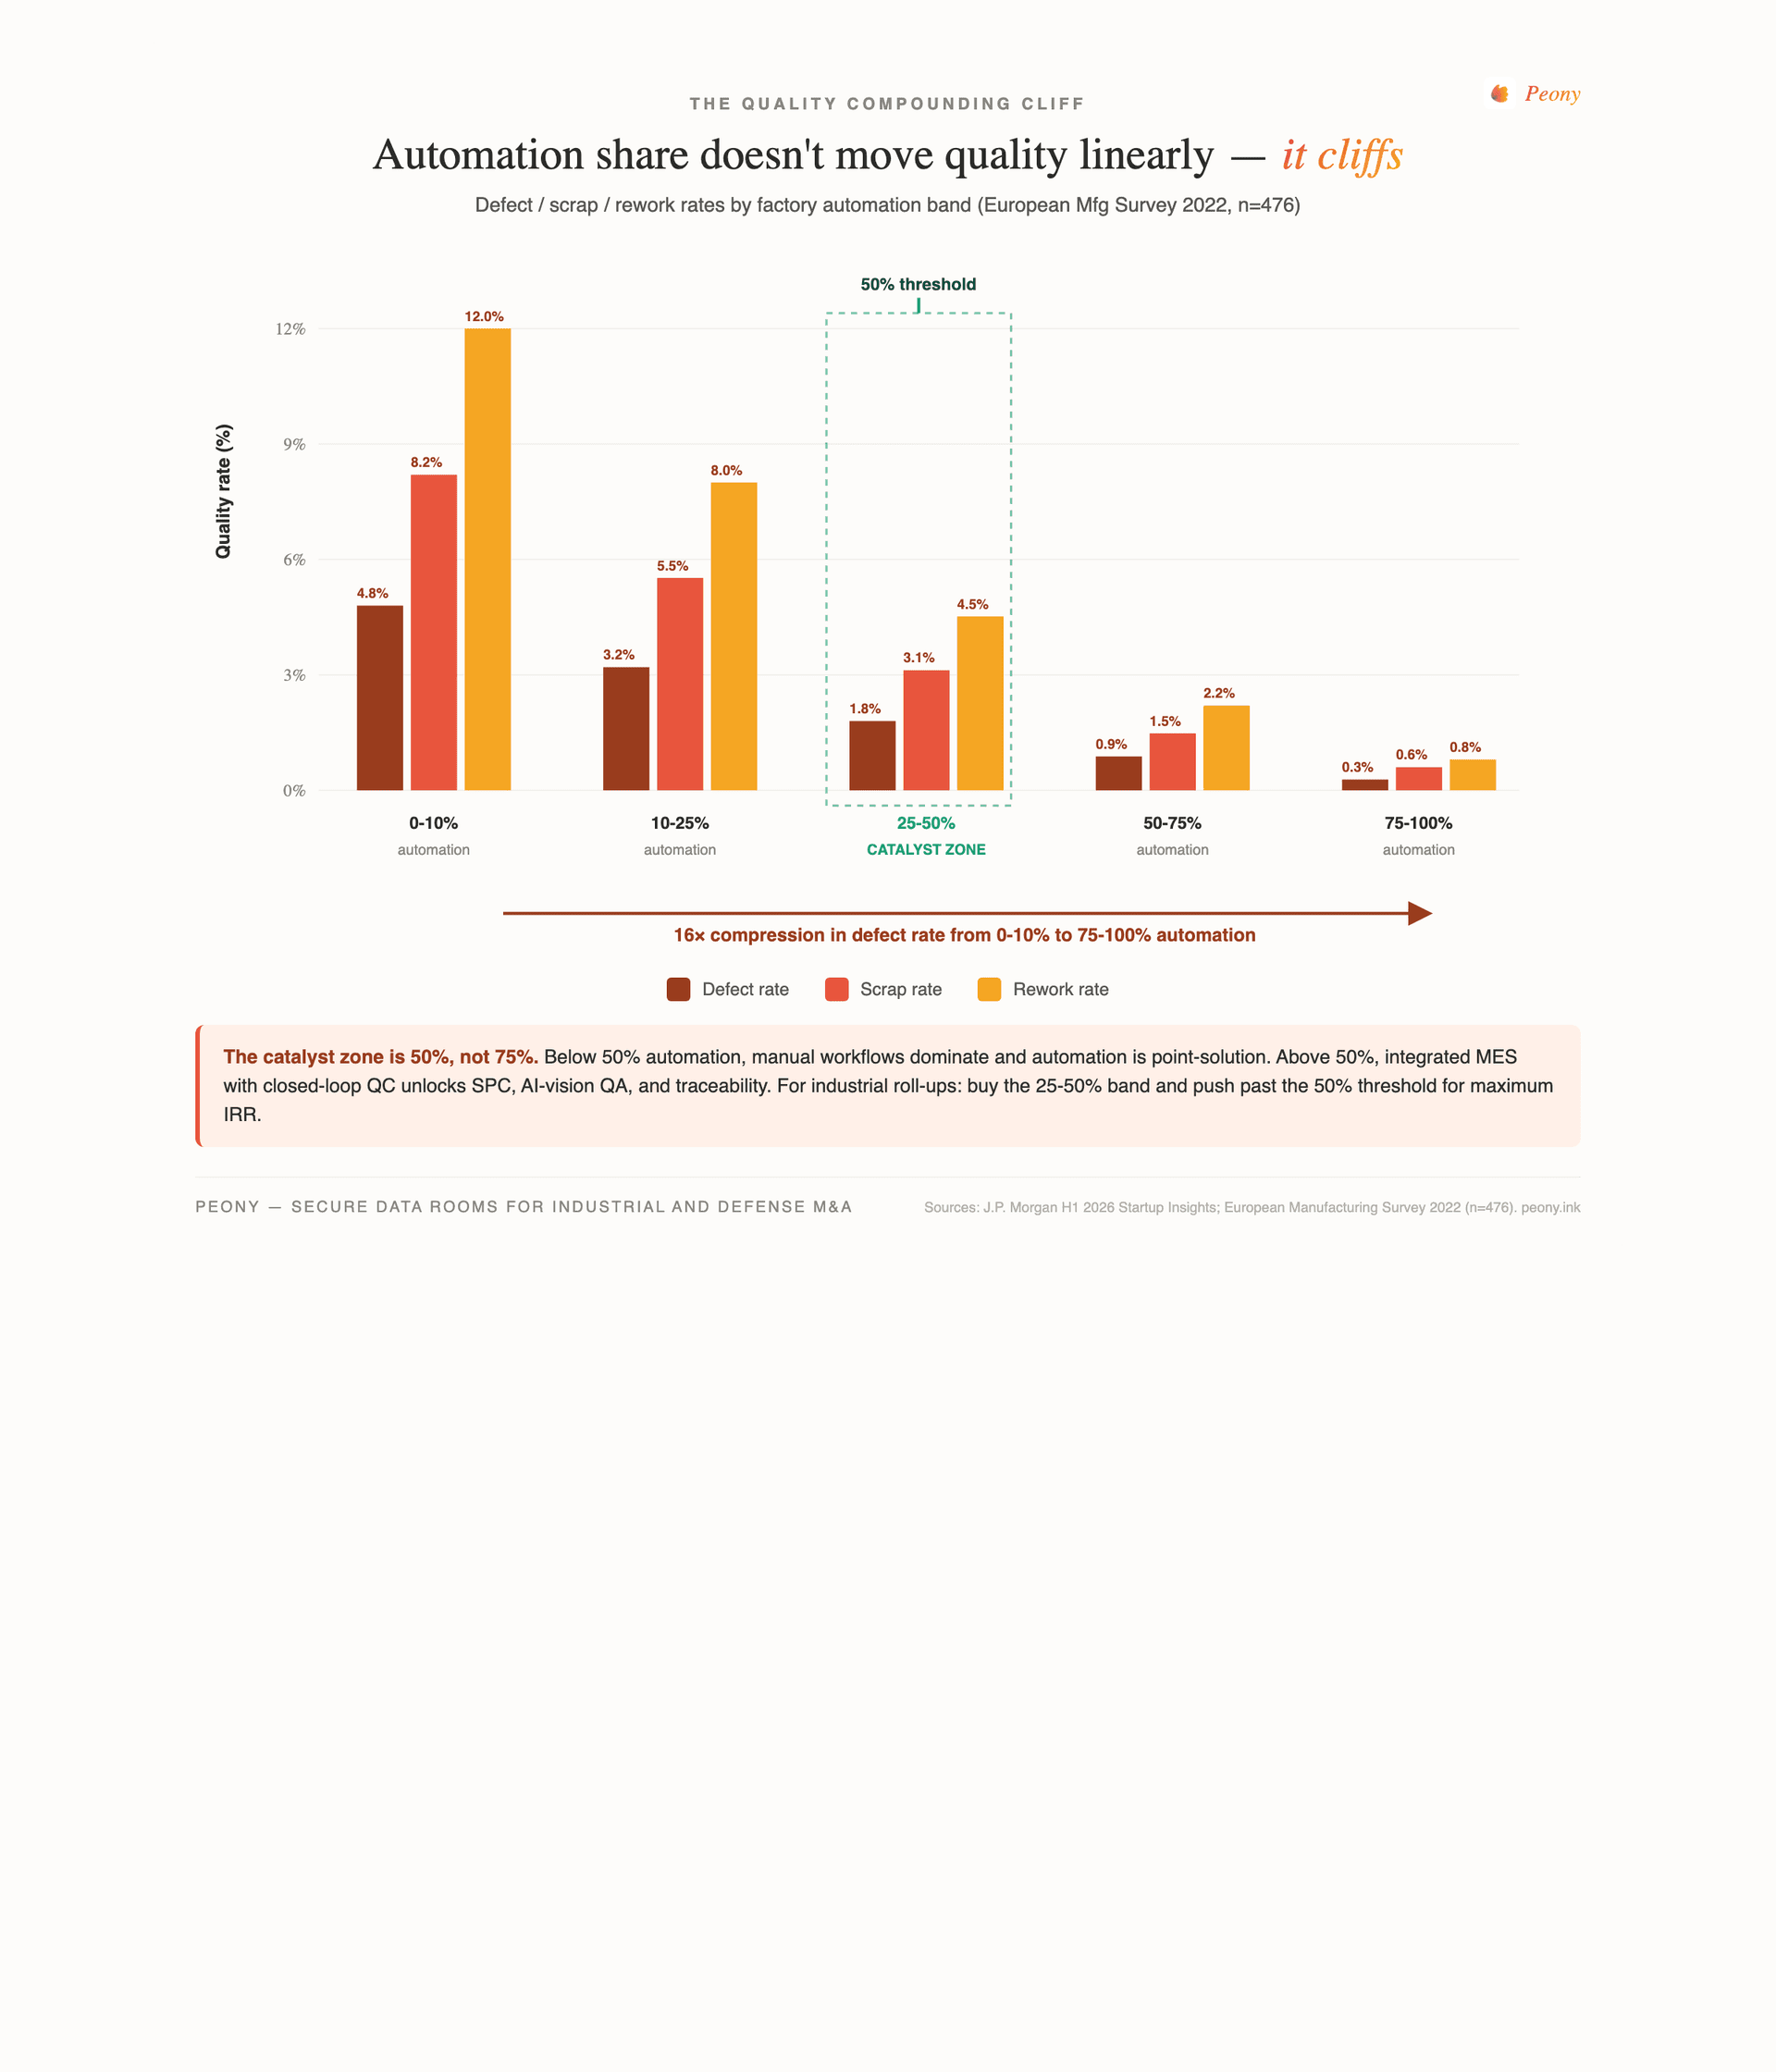
The compression is dramatic: going from 0-10% automation to 75-100% reduces defect rate by 16 times, scrap by 14 times, and rework by 15 times. But the biggest gains come from crossing the 50% threshold, not the 25% or 75% boundaries. Below 50%, manual workflows dominate and automation is point-solution; above 50%, integrated MES with closed-loop quality control becomes feasible. The transition unlocks statistical process control, AI-vision QA, and full traceability.
Proprietary frame: Quality Compounding Cliff
Automation share does not move quality metrics linearly — it produces a cliff. Going from 0-10% automation to 75-100% reduces defect rate by 16x, scrap by 14x, and rework by 15x. The biggest gains come from crossing the 50% threshold, not the 25% or 75% boundaries. Below 50%, manual workflows dominate; above 50%, integrated MES with closed-loop quality control becomes feasible. Decision rule: when underwriting industrial roll-ups, the highest IRR comes from buying portfolio companies in the 25-50% automation band and pushing them through the 50%+ threshold. Avoid 10-25% targets — they are stuck below the catalyst point and require disproportionate capex to clear the ridge.
For PE associates and industrial corp-dev, the practical version of this frame is to screen targets by their automation share before underwriting. A 30% automation target that has identified the path to 60% can deliver outsized IRR by leveraging the quality cliff. A 20% automation target without a credible automation roadmap is stuck, and the IRR has to come from cost-cutting elsewhere.
Why does an industrial data room need a CMMC and ITAR trust stack?
The most underappreciated consequence of the manufacturing venture boom is the rising compliance bar for industrial and defense data rooms. Three regulatory pressures have converged in 2026:
CMMC Level 2 timeline (DoD):
- Phase 1 began November 10 2025 — self-assessments mandatory in new DoD contracts
- Third-party C3PAO assessments mandatory starting November 2026 — i.e., one year from now
- This creates a 12-month compliance crunch for roughly 80,000 DoD primes and subcontractors
- CMMC Level 2 = all 110 NIST SP 800-171 Rev 2 security requirements across 14 control families
- System Security Plan (SSP) is a required artifact
ITAR compliance for ownership changes:
- ITAR registration amendment required within 5 days of a change of ownership
- USML amendments effective September 15 2025 moved some technology in and out of ITAR scope — every DR must be re-classified
- "Organization can be ITAR-compliant and still fail CMMC L2" — and vice versa
- For foreign buyers: even U.S.-citizen advisors of the foreign buyer may be deemed export if engaging data on behalf of foreign entity
EAR + Cybersecurity controls:
- ITAR data + EAR data = "CUI Specified" subset = enhanced handling
- DOJ recently settled with Swiss Automation Inc. over ITAR cyber violations — first-of-its-kind enforcement
- DCSA FOCI mitigation required before foreign-controlled acquirer can exercise control
For defense and dual-use M&A, this means the data room is now a deal-killer or deal-saver, not a back-office convenience. Sellers without a compliant DR face 10-30% bid discounts because buyers price in the compliance risk and the remediation cost. The control stack that has to be in place:
- U.S.-person access gating — DR access restricted to U.S. citizens / LPRs by default, with documented foreign-national exclusion logic
- ITAR/EAR document tagging — each file classified against the U.S. Munitions List (USML) and Commerce Control List (CCL) before upload
- NIST 800-171 control-mapped audit logs — every access event logged and retained per the 14 control families
- FIPS-validated cryptography — AES-256 at rest, TLS 1.3 in transit
- IP escrow workflow — drawings, source code, and BOM under separate access controls with cryptographic chain-of-custody
- MFA enforcement across all access
- Time-bound view-only with watermarking for sensitive technical drawings
- BOM / supplier overlap masking to prevent supply chain attack surface exposure during due diligence
Proprietary frame: Industrial Data Room Trust Stack
Defense and dual-use M&A targets require a five-layer VDR trust stack that conventional finance data rooms do not ship: (1) U.S.-person access gating, (2) ITAR/EAR document tagging, (3) NIST 800-171 control-mapped audit logs, (4) FIPS-validated cryptography at rest and in transit, (5) IP escrow workflow for drawings and source. Skip any layer and the deal kills at compliance review. Decision rule: for any defense or dual-use seller above $50M deal size, the cost of building a compliant DR ($75K-$150K all-in) is dwarfed by the deal-killer risk of an ITAR violation or CMMC audit fail at LOI. Sellers without this stack face 10-30% bid discounts.
The 244,000 reshoring jobs announced in 2024 — 67% concentrated in semiconductors, EV batteries, and solar (all ITAR-adjacent or EAR-controlled) — plus $4.7B in defense manufacturing deals in 2025 means every transaction in these verticals now has CMMC/ITAR data room exposure. The deal teams that have built or bought compliant DR infrastructure ahead of November 2026 will be the ones running smooth diligence sprints next year.
What does this mean for industrial founders, corp-dev, and capital allocators?
Five practical implications follow from the Q1 2026 data:
1. The manufacturing venture boom is real and accelerating. $91B 2026 pace versus $50B in 2025 versus $25B in 2024. AI-enabled startups taking 56% of capital is a real pivot to production, not a deck-tagging artifact. Founders building in advanced manufacturing, robotics, defense, batteries, or semiconductors should price aggressively — the capital is available.
2. The second reshoring wave is forming. GSCPI re-spiked to 1.82 in April 2026 (from 0.68 in March). If it sustains, the 6-month lag model predicts a Q4 2026 / Q1 2027 reshoring inflection. This wave will be tariff- and geopolitically-driven, funded by PE and venture rather than CHIPS subsidies. Position M&A pipelines accordingly.
3. Defense is no longer niche. $49.1B in 2025 defense tech VC (up 81% YoY), Anduril at $61B, Saronic at $9.25B, Skild AI at $14B. The 5.1% → 8.3% founder pivot is the largest single sector shift in modern manufacturing entrepreneurship. Corp-dev and capital allocators ignoring defense in 2026 are leaving the largest growth vector on the table.
4. CMMC and ITAR compliance is now a deal-killer or deal-saver. Mandatory third-party assessments begin November 2026. Sellers without an ITAR-compliant data room face 10-30% bid discounts. The 12-month window to build compliance is open now. After November 2026, the cost of remediation under audit pressure is materially higher.
5. Underwriting industrial roll-ups requires automation-band discipline. The Quality Compounding Cliff means the highest IRR comes from buying portfolio companies in the 25-50% automation band and pushing them past the 50% threshold. The 10-25% cohort is stuck. Use automation level as a primary screen, not an afterthought.
Where does Peony fit (and where it doesn't)?
Peony builds the data room layer that deal teams use during industrial and defense M&A, fundraising, and investor reporting. We have served 5,900-plus deal teams — and as the manufacturing venture wave has accelerated, we have invested heavily in the controls that industrial and defense deals require.

Where Peony fits: industrial, defense, dual-use, and capital-intensive sector deal teams running $10M-$500M deal sizes who need U.S.-person access gating, ITAR/EAR document tagging, NIST 800-171 audit logs, FIPS-validated cryptography, time-bound watermarked viewing, and IP escrow workflows — without the legacy-VDR price tag or onboarding friction. Particularly strong fit for defense-tech founders raising Series A through Series C who need a data room that scales from fundraising to M&A diligence without re-platforming.
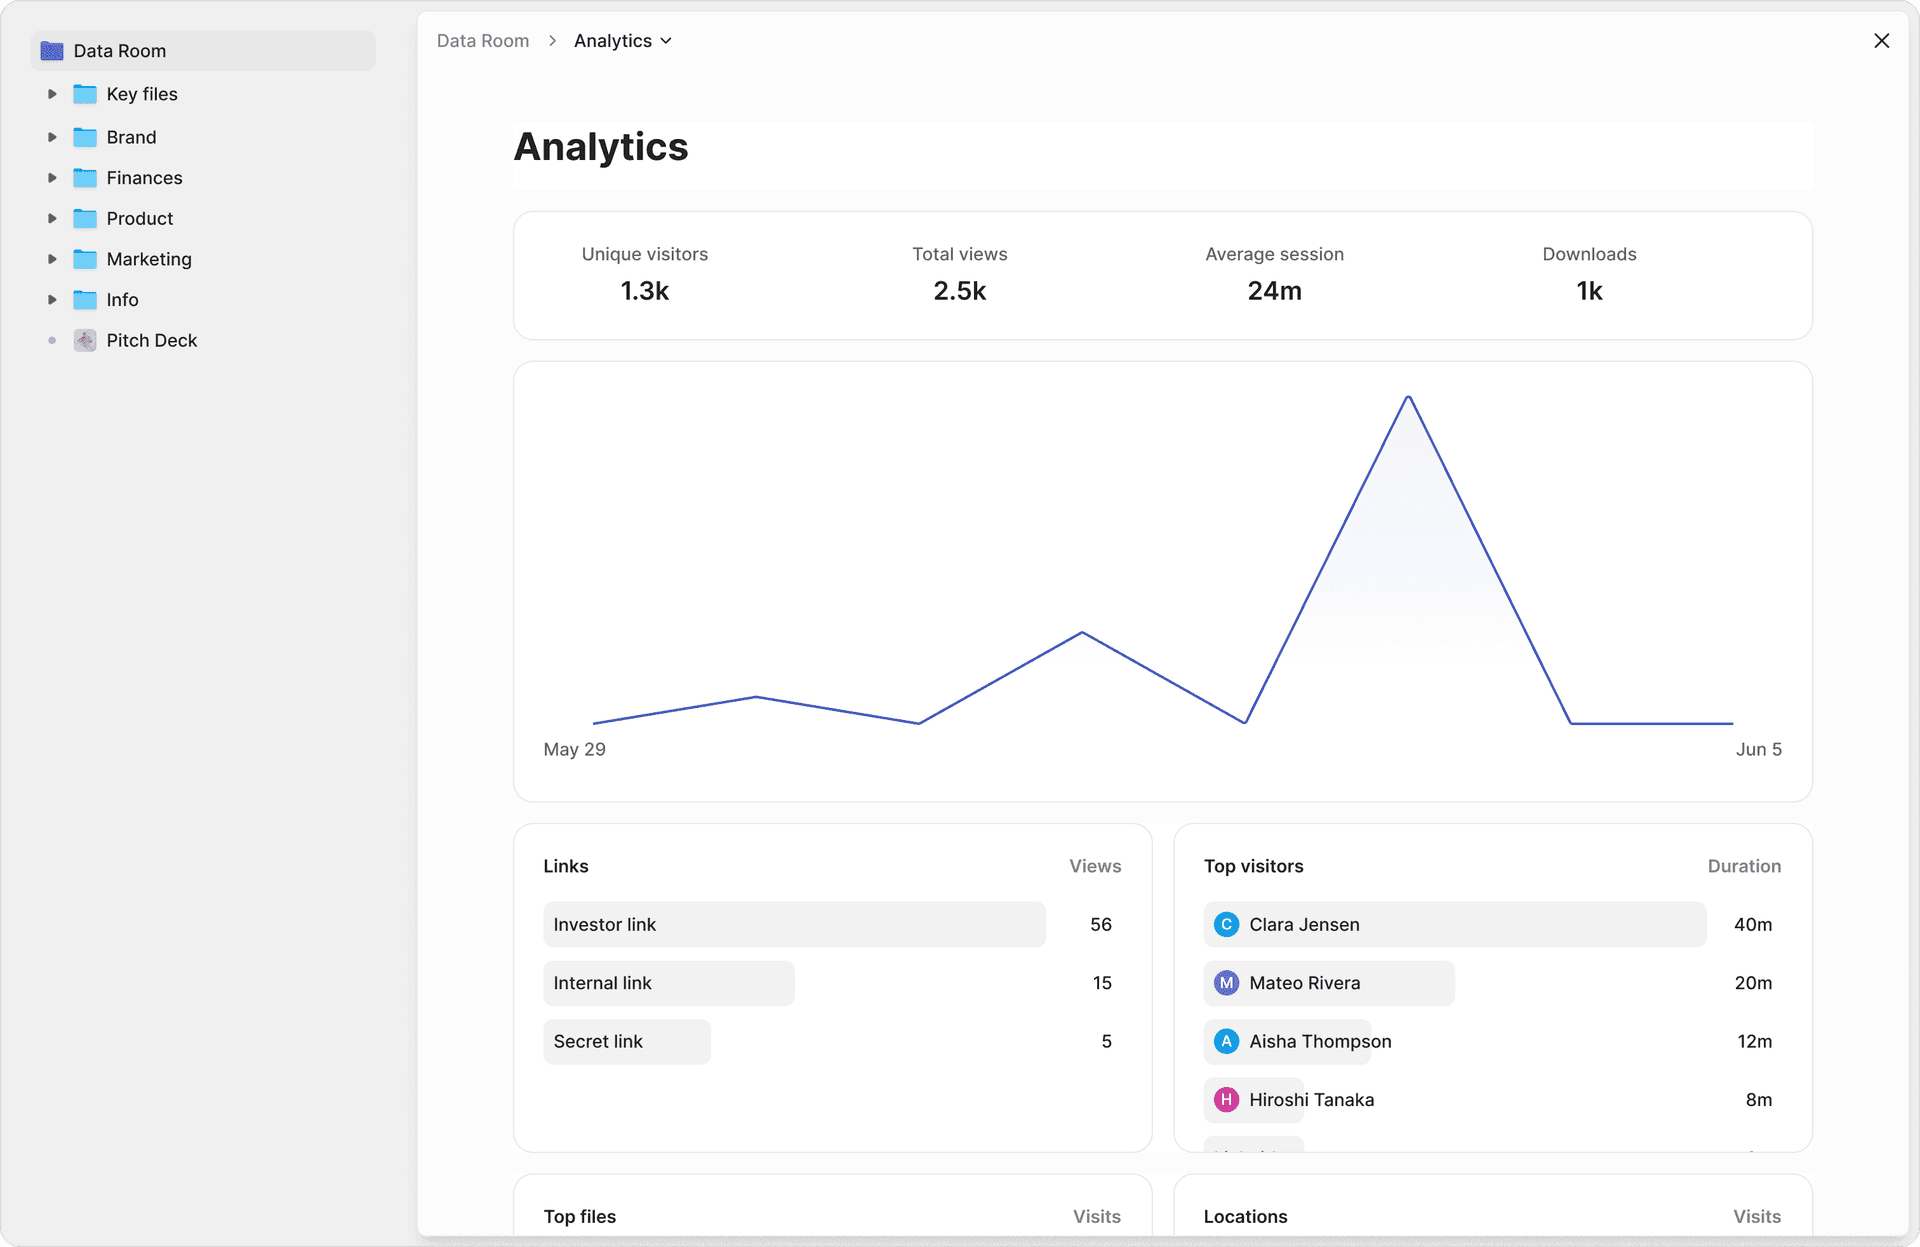
The investor and buyer side gets per-recipient link control and engagement signals — you can see which counterparties have opened the financial model, who has spent time on the cap table, and who has only briefly clicked into the security folder. Diligence becomes a conversation about evidence, not a series of email back-and-forths.
Where Peony does not fit: the largest cleared defense primes that mandate IL5/IL6 hosting on GovCloud-equivalent dedicated infrastructure — those workflows still belong on cleared-platform VDRs. We focus on the broad middle market of industrial and defense deal teams who need enterprise-grade compliance without the legacy VDR price tag.
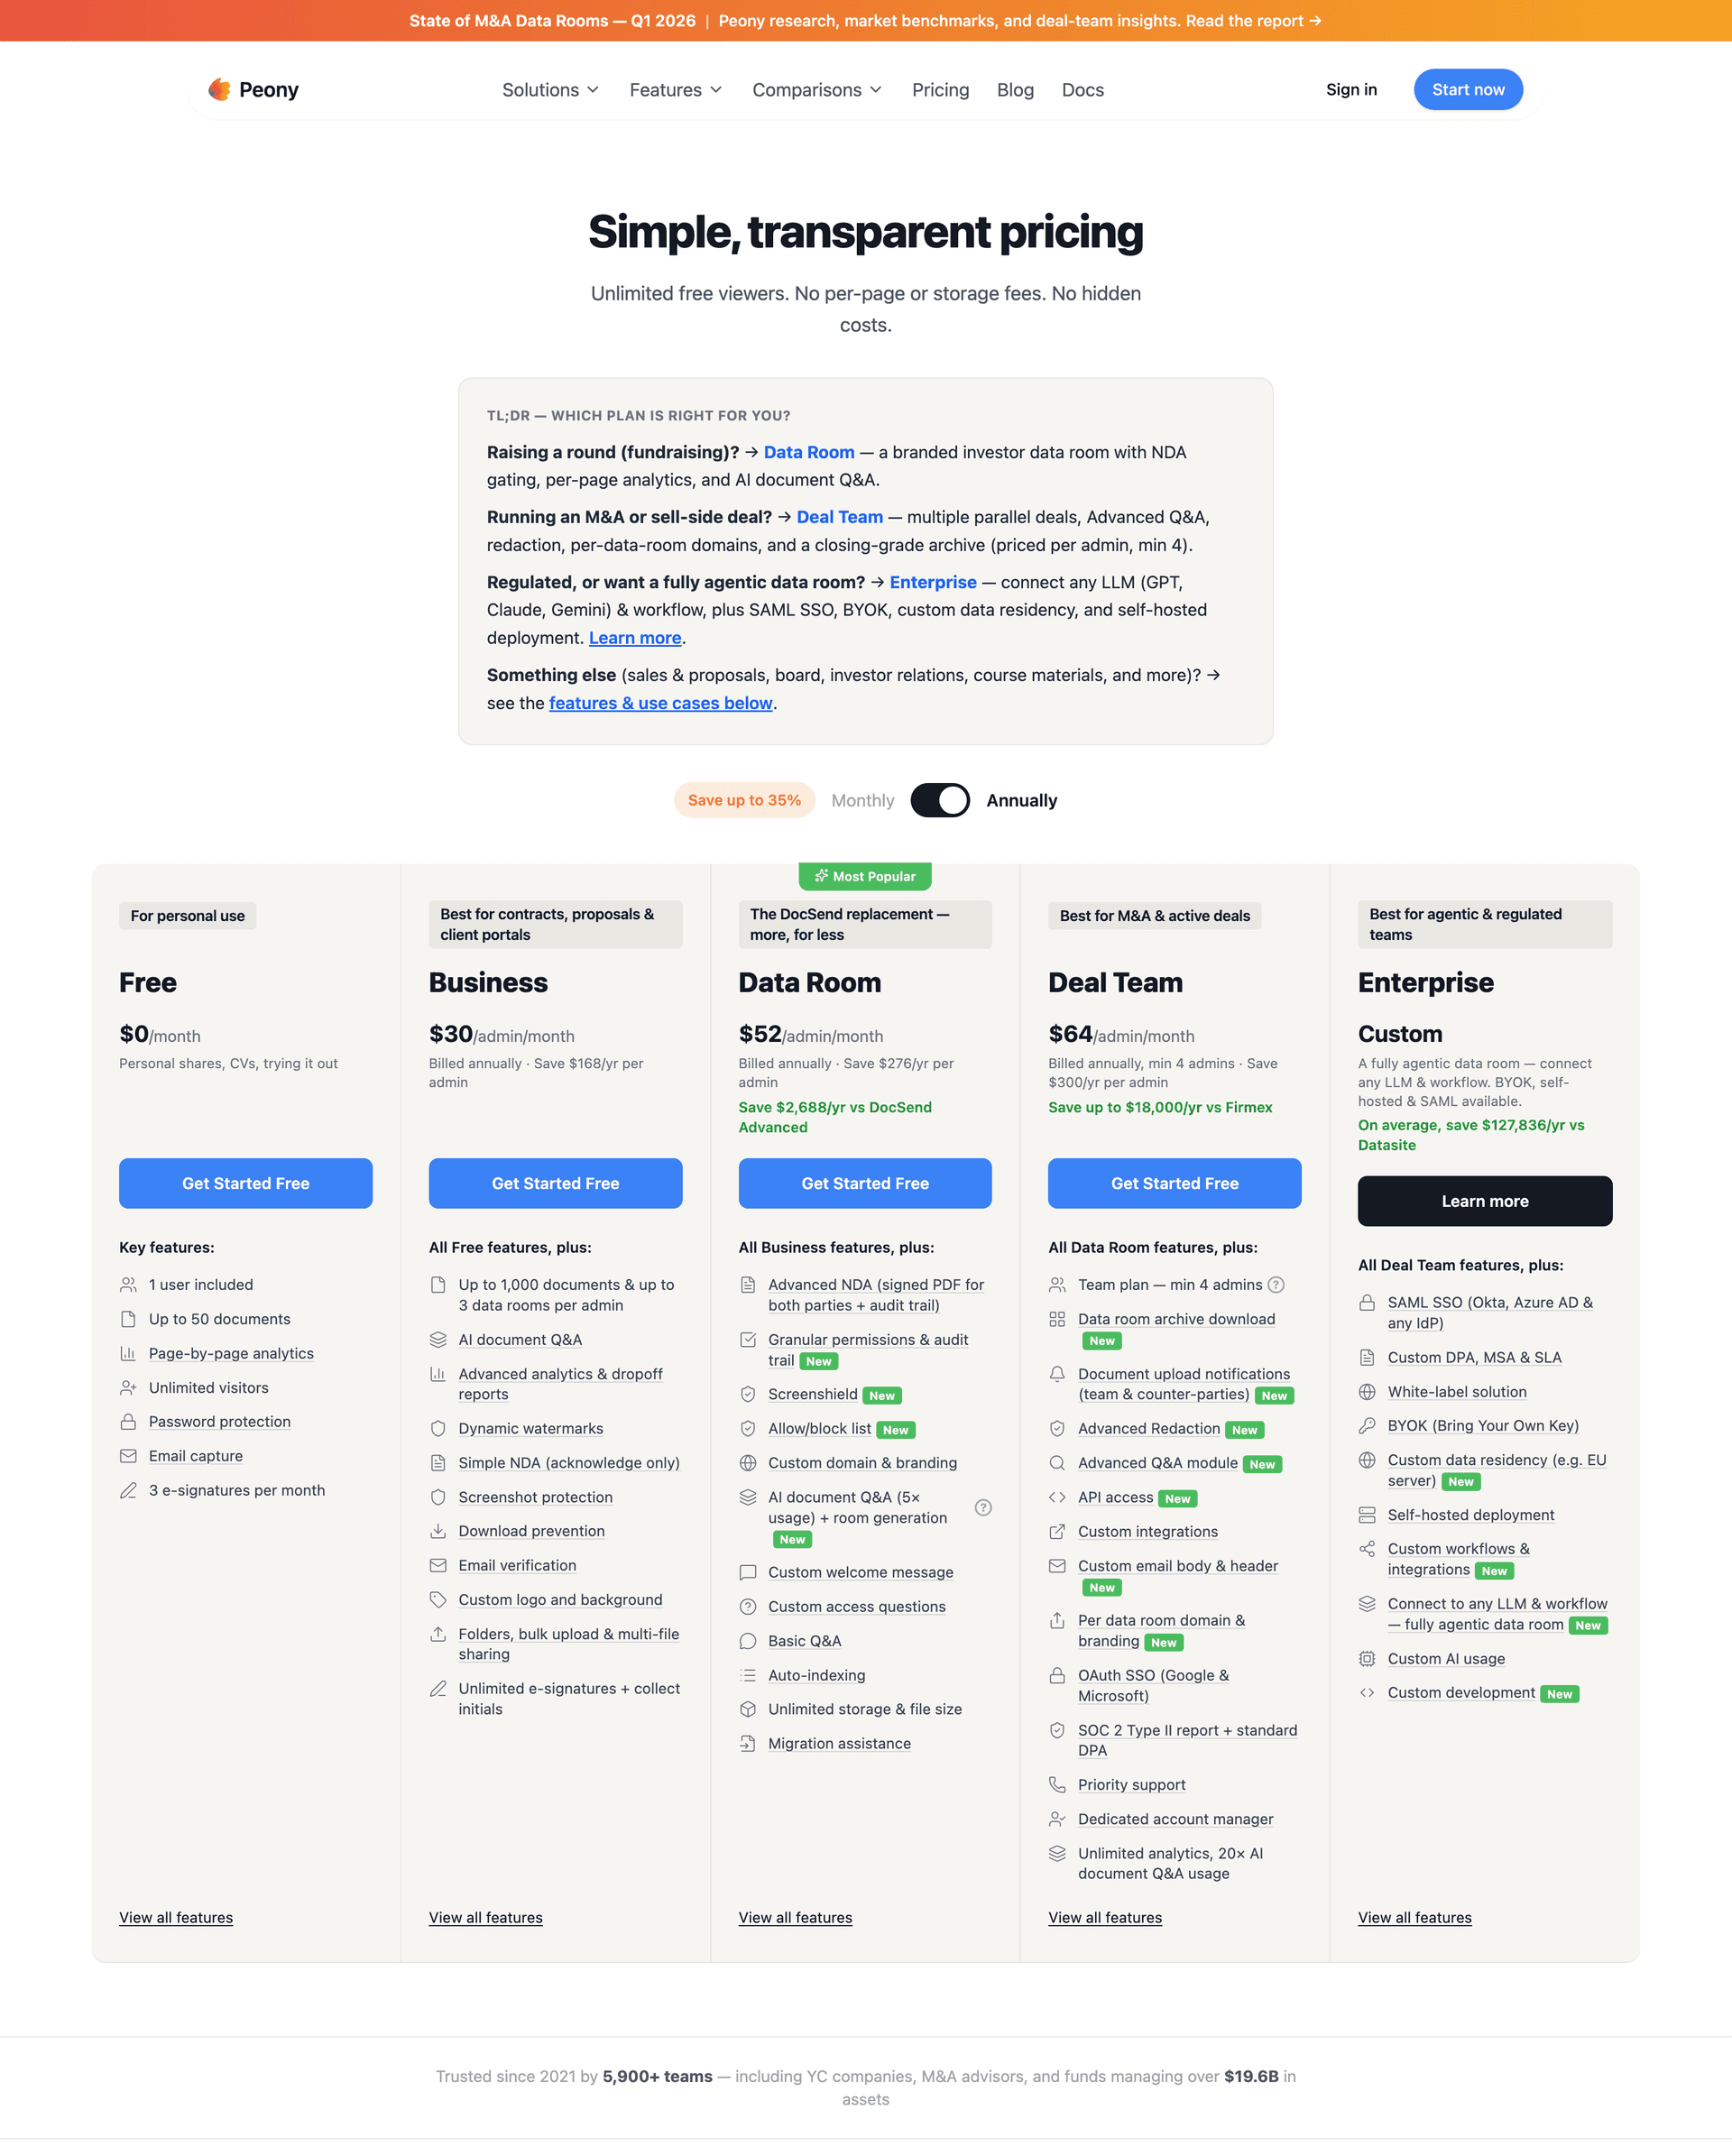
For pricing and tier details, see our pricing page. Startup-friendly tiers begin below most legacy VDR comparison points, and enterprise tiers include the full ITAR/CMMC control stack.
Bottom line
The manufacturing venture wave is real, accelerating, and bifurcating. $91B 2026 pace, 56% AI-enabled capital share, $49B defense tech VC in 2025, and Anduril at $61B anchor the headline numbers. But the deeper story is that the boom is now layered — subsidy-led first-wave reshoring is peaking and rolling over; tariff- and geopolitically-driven second-wave reshoring is forming, with the April 2026 GSCPI spike pointing to a Q4 2026 inflection. AI is taking the marginal manufacturing dollar because it unlocks the data foundation that 75% of legacy and partially-automated plants cannot. Humanoid capital is concentrating ruthlessly at the top — Figure at $39B, four challengers in the $5-14B band, no middle market.
For founders, corp-dev, and capital allocators, the practical playbook is to price the wave aggressively where you have an AI or defense angle, prepare for the second reshoring wave with positioned M&A pipelines, screen industrial roll-ups by automation band rather than headline EBITDA, and — critically — build ITAR and CMMC compliance into your data room before November 2026 makes remediation under audit pressure materially more expensive. The deal teams that move first on the compliance gate will run smooth diligence sprints in 2027 while their peers scramble.
Frequently Asked Questions
How big is the 2026 manufacturing venture boom?
Q1 2026 saw roughly $22B of U.S. manufacturing venture capital deployed (J.P. Morgan H1 2026), extrapolating to a $91B full-year pace versus $50B in 2025 and $25B in 2024. PitchBook-NVCA reports the all-sector record of $267.2B in Q1 2026 deal value, though excluding the top 5 deals the figure falls 73.2%.
Why has AI-enabled manufacturing crossed half of all capital?
AI-enabled manufacturing startups captured 56% of manufacturing venture dollars in Q1 2026 — up from 8% in 2015, 21% in 2020, and 45% in 2025. KPMG's 2026 Industrial Manufacturing Tech Report finds 49% of industrial executives report AI delivering business value, with 68% expecting scaled deployment within 12 months. PitchBook calls Q1 2026 the pivot quarter from pilot AI to full-scale agentic deployments.
What does the reshoring 6-month lag predict for Q4 2026?
The NY Fed GSCPI spiked from 0.68 in March 2026 to 1.82 in April. J.P. Morgan's reshoring data shows supply-chain shocks reach reshoring announcements with a roughly 6-month lag (R-squared = 55%). If GSCPI sustains above 1.5, the second reshoring wave hits Q4 2026 / Q1 2027 — funded by private capital and tariff-driven, rather than CHIPS-driven.
Why are humanoid robots a bimodal market?
2025-2026 humanoid venture activity totaled $3B but went to less than 8% of robotics deals. The cap stack is bimodal — Figure AI at $39B, four challengers in the $5-14B range (Apptronik, Skild AI, 1X, Agility), and everyone else dropping below $500M. Foundation-model-style winner-take-most dynamics plus scarce Nvidia and factory partnerships drive the concentration.
How fast are robot costs falling versus human compensation?
Robot effective cost fell roughly 70% in 14 years — from $7,500 in 2010 to $2,300 in 2024 on amortized terms. The human-to-robot cost ratio grew 400% over the same period, from 4.8 times to 20.0 times. ARK Invest projects humanoid average selling price will fall from $114,700 in 2024 to roughly $37,000 by 2030.
What does the defense founder surge mean for manufacturing M&A?
Aerospace and defense as percentage of new manufacturing startup founder focus jumped from 5.1% (2015-2019) to 8.3% (2020-2025), a 63% relative increase — the largest sector pivot in modern manufacturing entrepreneurship. Defense tech VC hit $49.1B in 2025, up 81% YoY. Anduril, Saronic, Skild AI, and True Anomaly anchor the wave.
Why does an industrial data room need a CMMC and ITAR trust stack?
CMMC Level 2 mandatory third-party assessments begin November 2026 for new DoD contracts. ITAR registration must amend within 5 days of any change of ownership. Defense and dual-use M&A targets need a five-layer VDR trust stack (U.S.-person access, ITAR/EAR tagging, NIST 800-171 control mapping, FIPS-validated cryptography, IP escrow). Sellers without this stack face 10-30% bid discounts.
How does automation share compound on quality outcomes?
The European Manufacturing Survey 2022 cohort analysis of 476 firms shows defect rate falls 16 times from 0-10% automation (4.8% defects) to 75-100% (0.3% defects). The biggest gains come from crossing the 50% threshold, where integrated MES with closed-loop quality control becomes feasible.
Related Resources
- Best Data Room for Oil and Gas Companies — capital-intensive sector vertical anchor
- M&A Data Room Guide — full M&A data room mechanics
- Due Diligence Process Guide — DD orchestration
- Hard vs Soft Due Diligence — qualitative DD complements
- Cybersecurity Due Diligence — defense-relevant DD layer
- Operational Due Diligence — manufacturing operations DD
- Data Room for Investors — fundraising-side DR for industrial founders
- Q1 2026 Startup Fundraising Benchmarks — companion data report on broader VC market
You might also like
May 20, 2026
Q1 2026 Startup Fundraising Benchmarks: $3M Median Seed, $20M Series A, 23% Dilution — and Why the 18-Month Rule Just Died
Apr 20, 2026
12 Manufacturing Capital Partners Funding Independent Sponsors in 2026
Apr 5, 2026
Hardware Founder's Shenzhen Checklist (First Trip to First Production) in 2026