
Q1 2026 Startup Fundraising Benchmarks: $3M Median Seed, $20M Series A, 23% Dilution — and Why the 18-Month Rule Just Died

Co-founder at Peony. Former M&A at Nomura, early-stage VC at Backed VC, and growth-equity / secondaries investor at Target Global. I write about investors, fundraising, and deal advisors from the deal-side perspective I spent years in.
Q1 2026 Startup Fundraising Benchmarks: $3M Median Seed, $20M Series A, 23% Dilution — and Why the 18-Month Rule Just Died
TL;DR: In Q1 2026 the U.S. seed median deal size was $3.0M (J.P. Morgan H1 2026 Startup Insights) — confirmed independently by PitchBook-NVCA Q1 2026. Series A median is $20M on a $49M pre-money — roughly 23% dilution in a single close. The 18-24 month seed-to-A rule died: $30M+ Series A rounds closed in 14-15 months; sub-$10M rounds took ~22 months (bimodal velocity). Capital concentration accelerated — top 10 seed deals captured 17% of all seed capital in 2025, top 100 captured 31%, both roughly double 2020 levels. The 2025 Q1 2026 was the largest VC quarter on record ($300B globally per Crunchbase) — but excluding the top 5 mega-deals (Anthropic $30B, xAI $20B, Project Prometheus $10B, OpenAI tranches, Waymo $16B), PitchBook reports the figure falls 73.2%. Concentration is the whole story.
Last updated: May 2026
Why I wrote this
I run Peony, a data room company. Across the 5,900-plus deal teams who have used Peony for fundraising, M&A, and investor reporting, the single most common question I get from first-time founders is some version of "is my round size reasonable?" The honest answer is that the published 2024 benchmarks every founder is anchoring to are now misleading. Q1 2026 was an extreme outlier — the largest VC quarter on record, with capital concentrating to a tiny cohort of AI mega-rounds — and the headline medians, while still useful, hide a bimodal market that founders need to understand before they price a round.
This post is a deep-data benchmark report. I have read the J.P. Morgan H1 2026 Startup Insights PDF, reconciled it against the PitchBook-NVCA Q1 2026 Venture Monitor, the Carta State of Pre-Seed Q1 2026 and Founder Ownership 2026, and the Crunchbase Q1 2026 recap. I have layered eight proprietary frames Peony has developed from working with founders across pre-seed through Series C — frames that turn the headline stats into decision rules.
This post does not cover how to actually run a fundraise (that is in Startup Fundraising Strategy), how rounds work mechanically by stage (covered in Startup Fundraising Rounds Guide), or seed-specific how-to (covered in Seed Funding Guide). Here I am answering one question: what does the current data actually say, and what does it mean for the choices you are about to make?
What are the actual Q1 2026 seed and Series A medians?
The headline numbers from J.P. Morgan's H1 2026 Startup Insights, confirmed against PitchBook-NVCA and Carta, are:
| Stage | Median deal size | Average deal size | Median pre-money valuation |
|---|---|---|---|
| Pre-seed | ~$0.8M | ~$1.3M | ~$8M |
| Seed | $3.0M | $7.3M | $18M |
| Series A | $20M | $43M | $49M |
The gap between median and average tells the story. The seed median is $3.0M and the average is $7.3M — a 2.4-times multiple that signals a heavily right-skewed distribution. The Series A median is $20M but the average is $43M — a 2.2-times multiple driven by Anthropic's $30B Series G in February, xAI's $20B Series E in January, and Project Prometheus's $10B raise in April. The averages are technically correct but not useful for benchmarking — a founder pricing a typical Series A should anchor on $20M, not $43M.
PitchBook-NVCA Q1 2026 reports the same medians within rounding ($19.6M for Series A). Carta's post-money figures run roughly 20% higher than JPM's pre-money-derived equivalents — Carta's data over-indexes on San Francisco and AI cap tables, so when Carta reports a $24M median seed post-money it reflects the high-performer cohort, not the broad U.S. median. For a Bay Area AI startup, Carta is the right anchor. For everyone else, JPM and PitchBook are.
Q1 2026 deal counts are running below 2025 on a per-quarter basis — 882 seed deals (Q1 only) projects to roughly 3,500 for the year versus 4,832 in 2025, and 317 Series A deals projects to 1,268 versus 1,550 in 2025. Deal volume is down, dollars are up, and the entire gap is concentration. Pre-seed activity, by contrast, is stable — 233 deals in Q1 2026 projects to 932 versus 2025's 1,077.
The dealmaking indicator that J.P. Morgan publishes — a composite of early-stage negotiation power — sat at roughly 45 in Q1 2026, mildly founder-friendly. The historical extremes were ~20 in Q3 2021 (peak founder leverage) and ~85 in Q1-Q3 2024 (peak investor leverage). The current reading conceals the bimodality of the market — top-decile founders raising AI mega-rounds have all the leverage, while the median founder still negotiates against a soft buyer's market.
How is seed capital distributed across deal sizes in 2026?
The 2025 full-year seed distribution gives the cleanest view of where capital actually goes. The deciles are striking:
| Percentile | Seed deal size |
|---|---|
| 10th | $0.3M |
| 25th | $1.3M |
| 50th (median) | $3.2M |
| 75th | $6.0M |
| 90th | $10.0M |
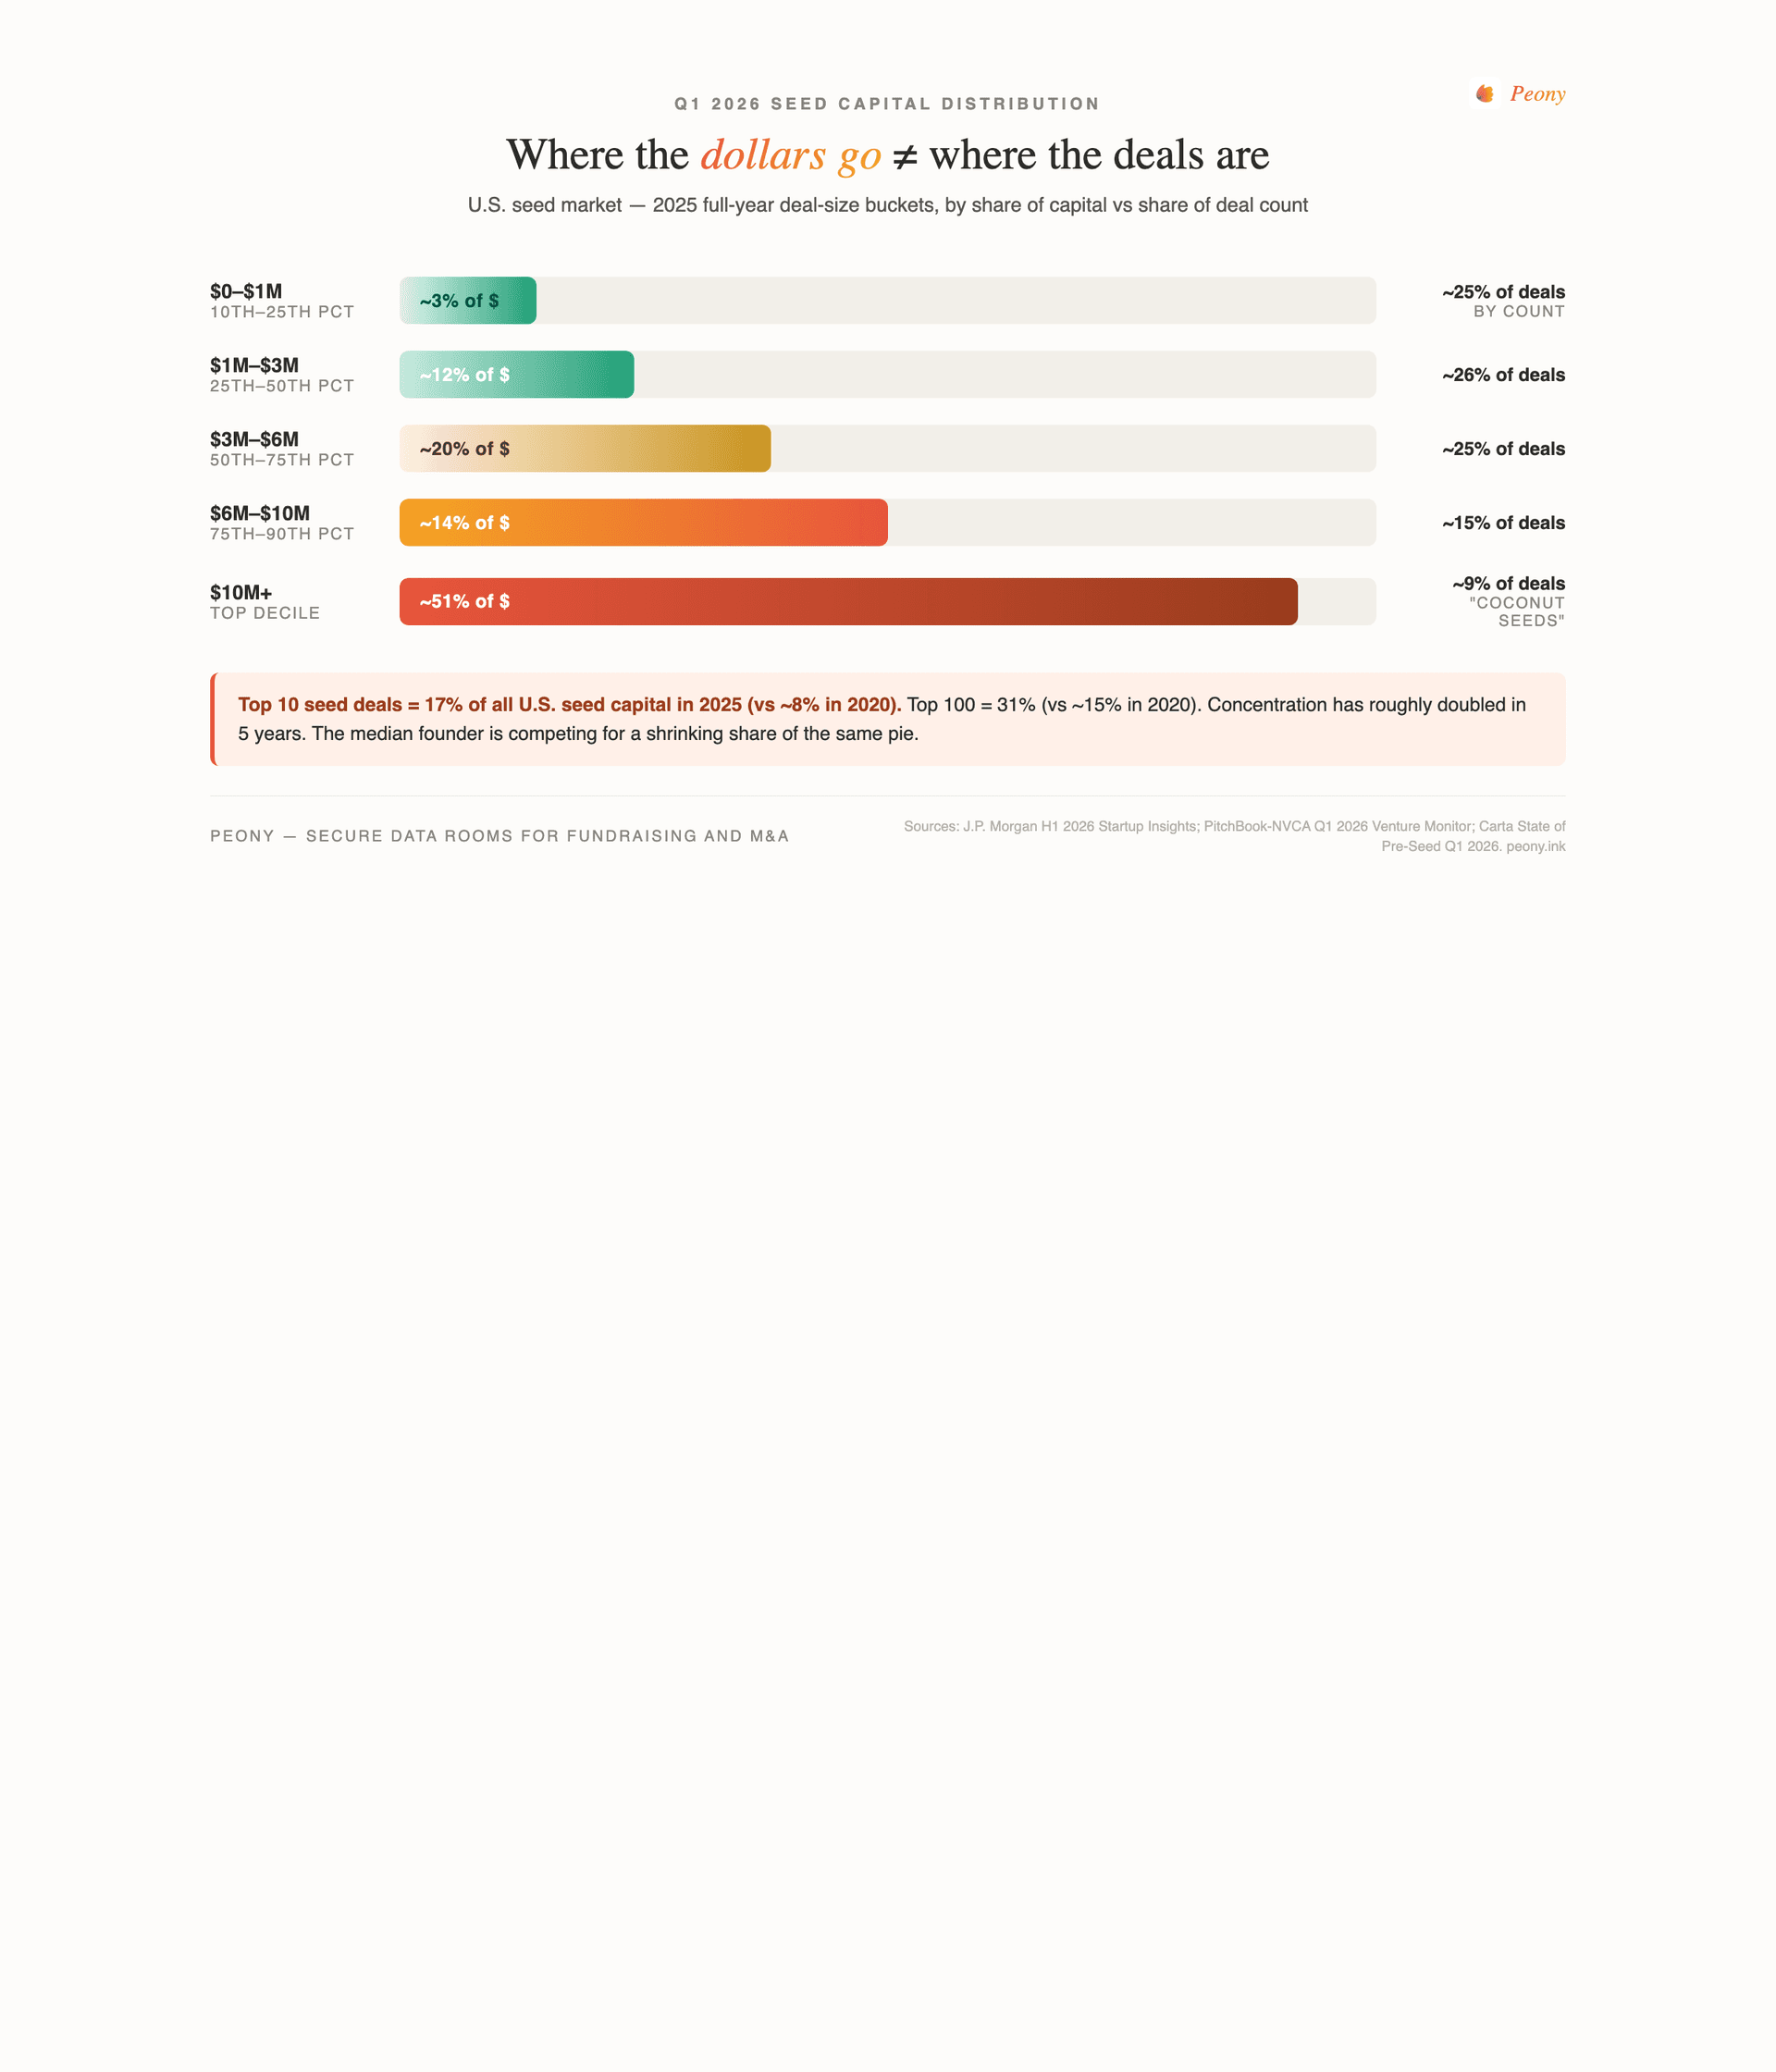
The 90th percentile sitting at $10M is the floor of what J.P. Morgan and a growing community of seed observers now call coconut seeds — outsized rounds that dwarf the median. In 2020, $10M-plus rounds were 1-2% of seed deal count and roughly 33% of seed capital. In 2025, they were 9-10% of deal count and 51-55% of all seed capital (Carta and JPM converge here).
The concentration story compounds further at the very top. Per J.P. Morgan's Q1 2026 data:
- Top 10 seed deals = 17% of all 2025 U.S. seed capital (up from ~8% in 2020)
- Top 100 seed deals = 31% of all 2025 U.S. seed capital (up from ~15% in 2020-21)
These two lines have approximately doubled in five years. Crunchbase's global view through a different lens reaches the same destination: globally, the top 629 companies that raised $100M-plus captured roughly 60% of all 2025 VC, and the top 68 companies that raised $500M-plus captured over 33% — up from 24% in 2024.
Put in plain language: in 2026, roughly half of all seed dollars go to the 9% of seed deals that exceed $10M, and roughly a third of that half goes to the top 100 of those deals. The median founder is competing for a shrinking share of the same pie. This is why benchmarking against the median is no longer enough — you also need to know which side of the concentration line you are on.
Proprietary frame: Coconut Seed Signal
A seed round above the 90th percentile ($10M-plus) does not look like 3-times the median seed — it looks like a different financial instrument that triggers different investor expectations downstream. Top-decile seeds compress the Series A timeline but raise the bar. To justify VC return economics on a $10M seed at a $50M post-money, the Series A must clear $200M-plus post-money — a 4-times step-up that only 10-15% of the cohort historically achieves at A. Founders should raise the smallest seed that funds 18-24 months of runway to Series A milestones. Above $6M (the 75th percentile), expect Series A board questions about traction parity to round size.
Why has the 18-24 month rule of thumb died?
For a decade, founders priced runway off the "raise 18-24 months between rounds" heuristic. J.P. Morgan's Q1 2026 data shows that rule is now actively misleading.
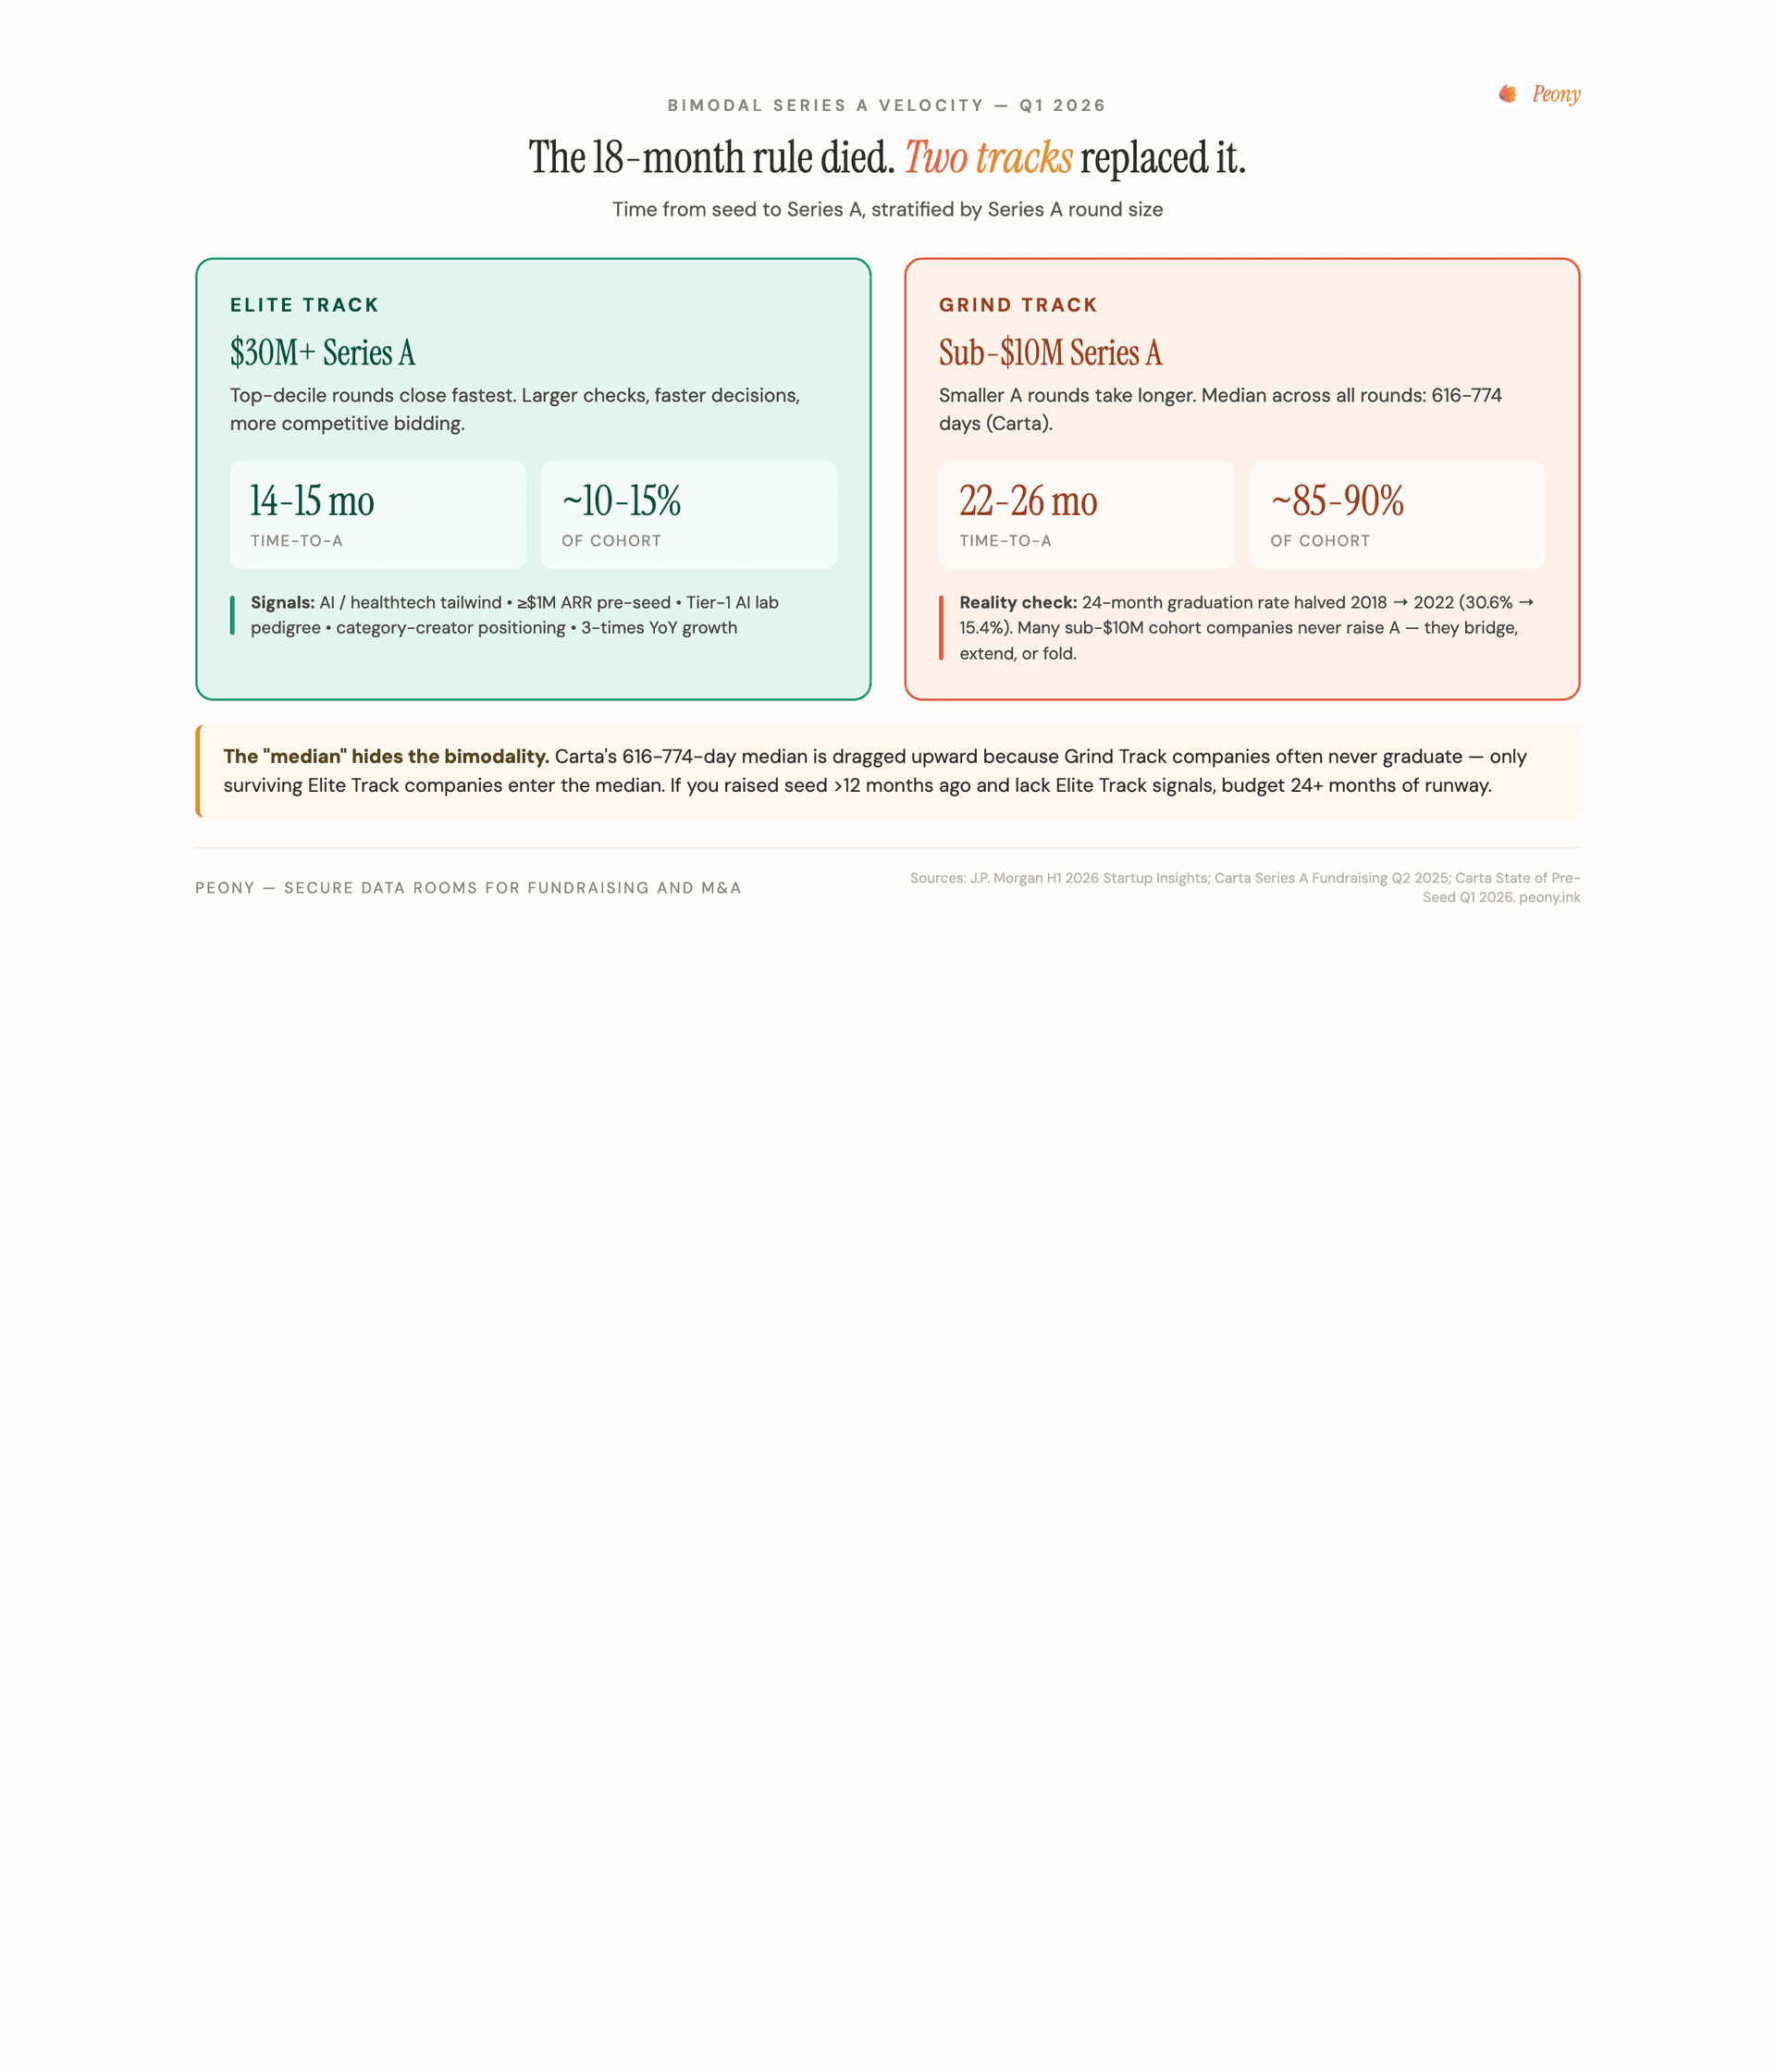
The headline finding from JPM's Series A cohort analysis: companies that raised a Series A in Q1 2025 through Q1 2026 fell into two buckets — those who raised $30M-plus closed in roughly 14-15 months from seed, and those who raised $0-10M took roughly 22 months. Larger rounds raised faster. This inverts the older intuition (more dollars = more diligence = slower close).
Carta's Series A Fundraising Q2 2025 report gives the unsegmented view — the median seed-to-Series-A interval was 616 days (~20.3 months) in Q2 2025 and 774 days (~25.5 months) in Q4 2024. Carta's median is across all sizes, so it sits well above JPM's elite-track 14-15 months. The two datasets do not conflict — they describe different cohorts. JPM stratifies by Series A size. Carta does not.
The graduation rate is the more sobering statistic. Carta tracked seed cohorts by quarter and measured what fraction reached Series A within 24 months:
| Seed cohort | Reached Series A within 24 months |
|---|---|
| Q1 2018 | 30.6% |
| Q1 2020 | ~22% (interpolated) |
| Q1 2022 | 15.4% |
| Q2 2024 | 8.9% by month 12 (still maturing) |
The 24-month graduation rate halved between 2018 and 2022. The 2024 cohort is running below the 2022 pace at the same checkpoint. The implication is brutal: the "median" time-to-Series-A is increasingly being dragged upward because Grind Track companies often never graduate at all, and only the surviving Elite Track companies enter the median.
Proprietary frame: Bimodal Series A Velocity
Time-to-Series-A in 2026 is no longer a single distribution. It is two distinct tracks: an Elite Track at sub-15 months for $30M-plus Series A rounds and a Grind Track at 22-26 months for sub-$10M Series A rounds. The Carta unsegmented median (616-774 days) hides this bimodality because it averages elite winners with stragglers — and because Grind Track companies often never raise an A. Decision rule for founders: if you raised seed more than 12 months ago and lack Elite Track signals (≥$1M ARR, ≥3-times YoY growth, AI/healthtech tailwind, pedigree from a Tier-1 AI lab), assume your Series A will take longer than 24 months and budget runway accordingly.
The practical consequence: a founder who raised a $3M seed in early 2025 and budgeted 18 months of runway is approaching wall time before having Series A-track traction. Bridge rounds, SAFE extensions, and revenue-based financing have grown to fill the gap. Carta data shows pre-seed: 93% of pre-priced deals in Q4 2025 were SAFEs (only 7% convertible notes); at seed, 64% were SAFEs, 27% priced equity, and 10% convertibles. Above $4M raise size, priced rounds become the norm. Most early-stage rounds in 2026 are still SAFE-priced, which means most "valuation data" is from cap conversions — actual price discovery happens at the priced round.
How much dilution should founders expect at Series A in 2026?
J.P. Morgan's Q1 2026 Series A dilution distribution:
| Percentile | Dilution |
|---|---|
| 25th | ~15% |
| 50th (median) | ~23% |
| 75th | ~31% |
Round size is the strongest single predictor — JPM's regression of dilution on round size at Series A produces an R-squared of 38%, the largest of any factor they tested. Location, by contrast, was statistically insignificant.
Carta's Founder Ownership 2026 reports slightly lower median dilution figures — 19-20% — which is best explained by sample bias (Carta over-indexes on later-stage rounds within its dataset) and a different averaging methodology. Both numbers are correct under their respective definitions. The directional story is identical: median Series A dilution sits in the 19-23% band, with a long tail at the 31% mark.
But the median-per-round figure understates the compounding reality. Carta's cumulative founder retention path:
| Stage | Median founder ownership retained |
|---|---|
| Pre-seed start | 100% |
| Post-pre-seed | ~85-90% |
| Post-seed | 56% |
| Post-Series A | 36% |
| Post-Series B (digital) | 27.3% |
| Post-Series B (physical) | ~22% |
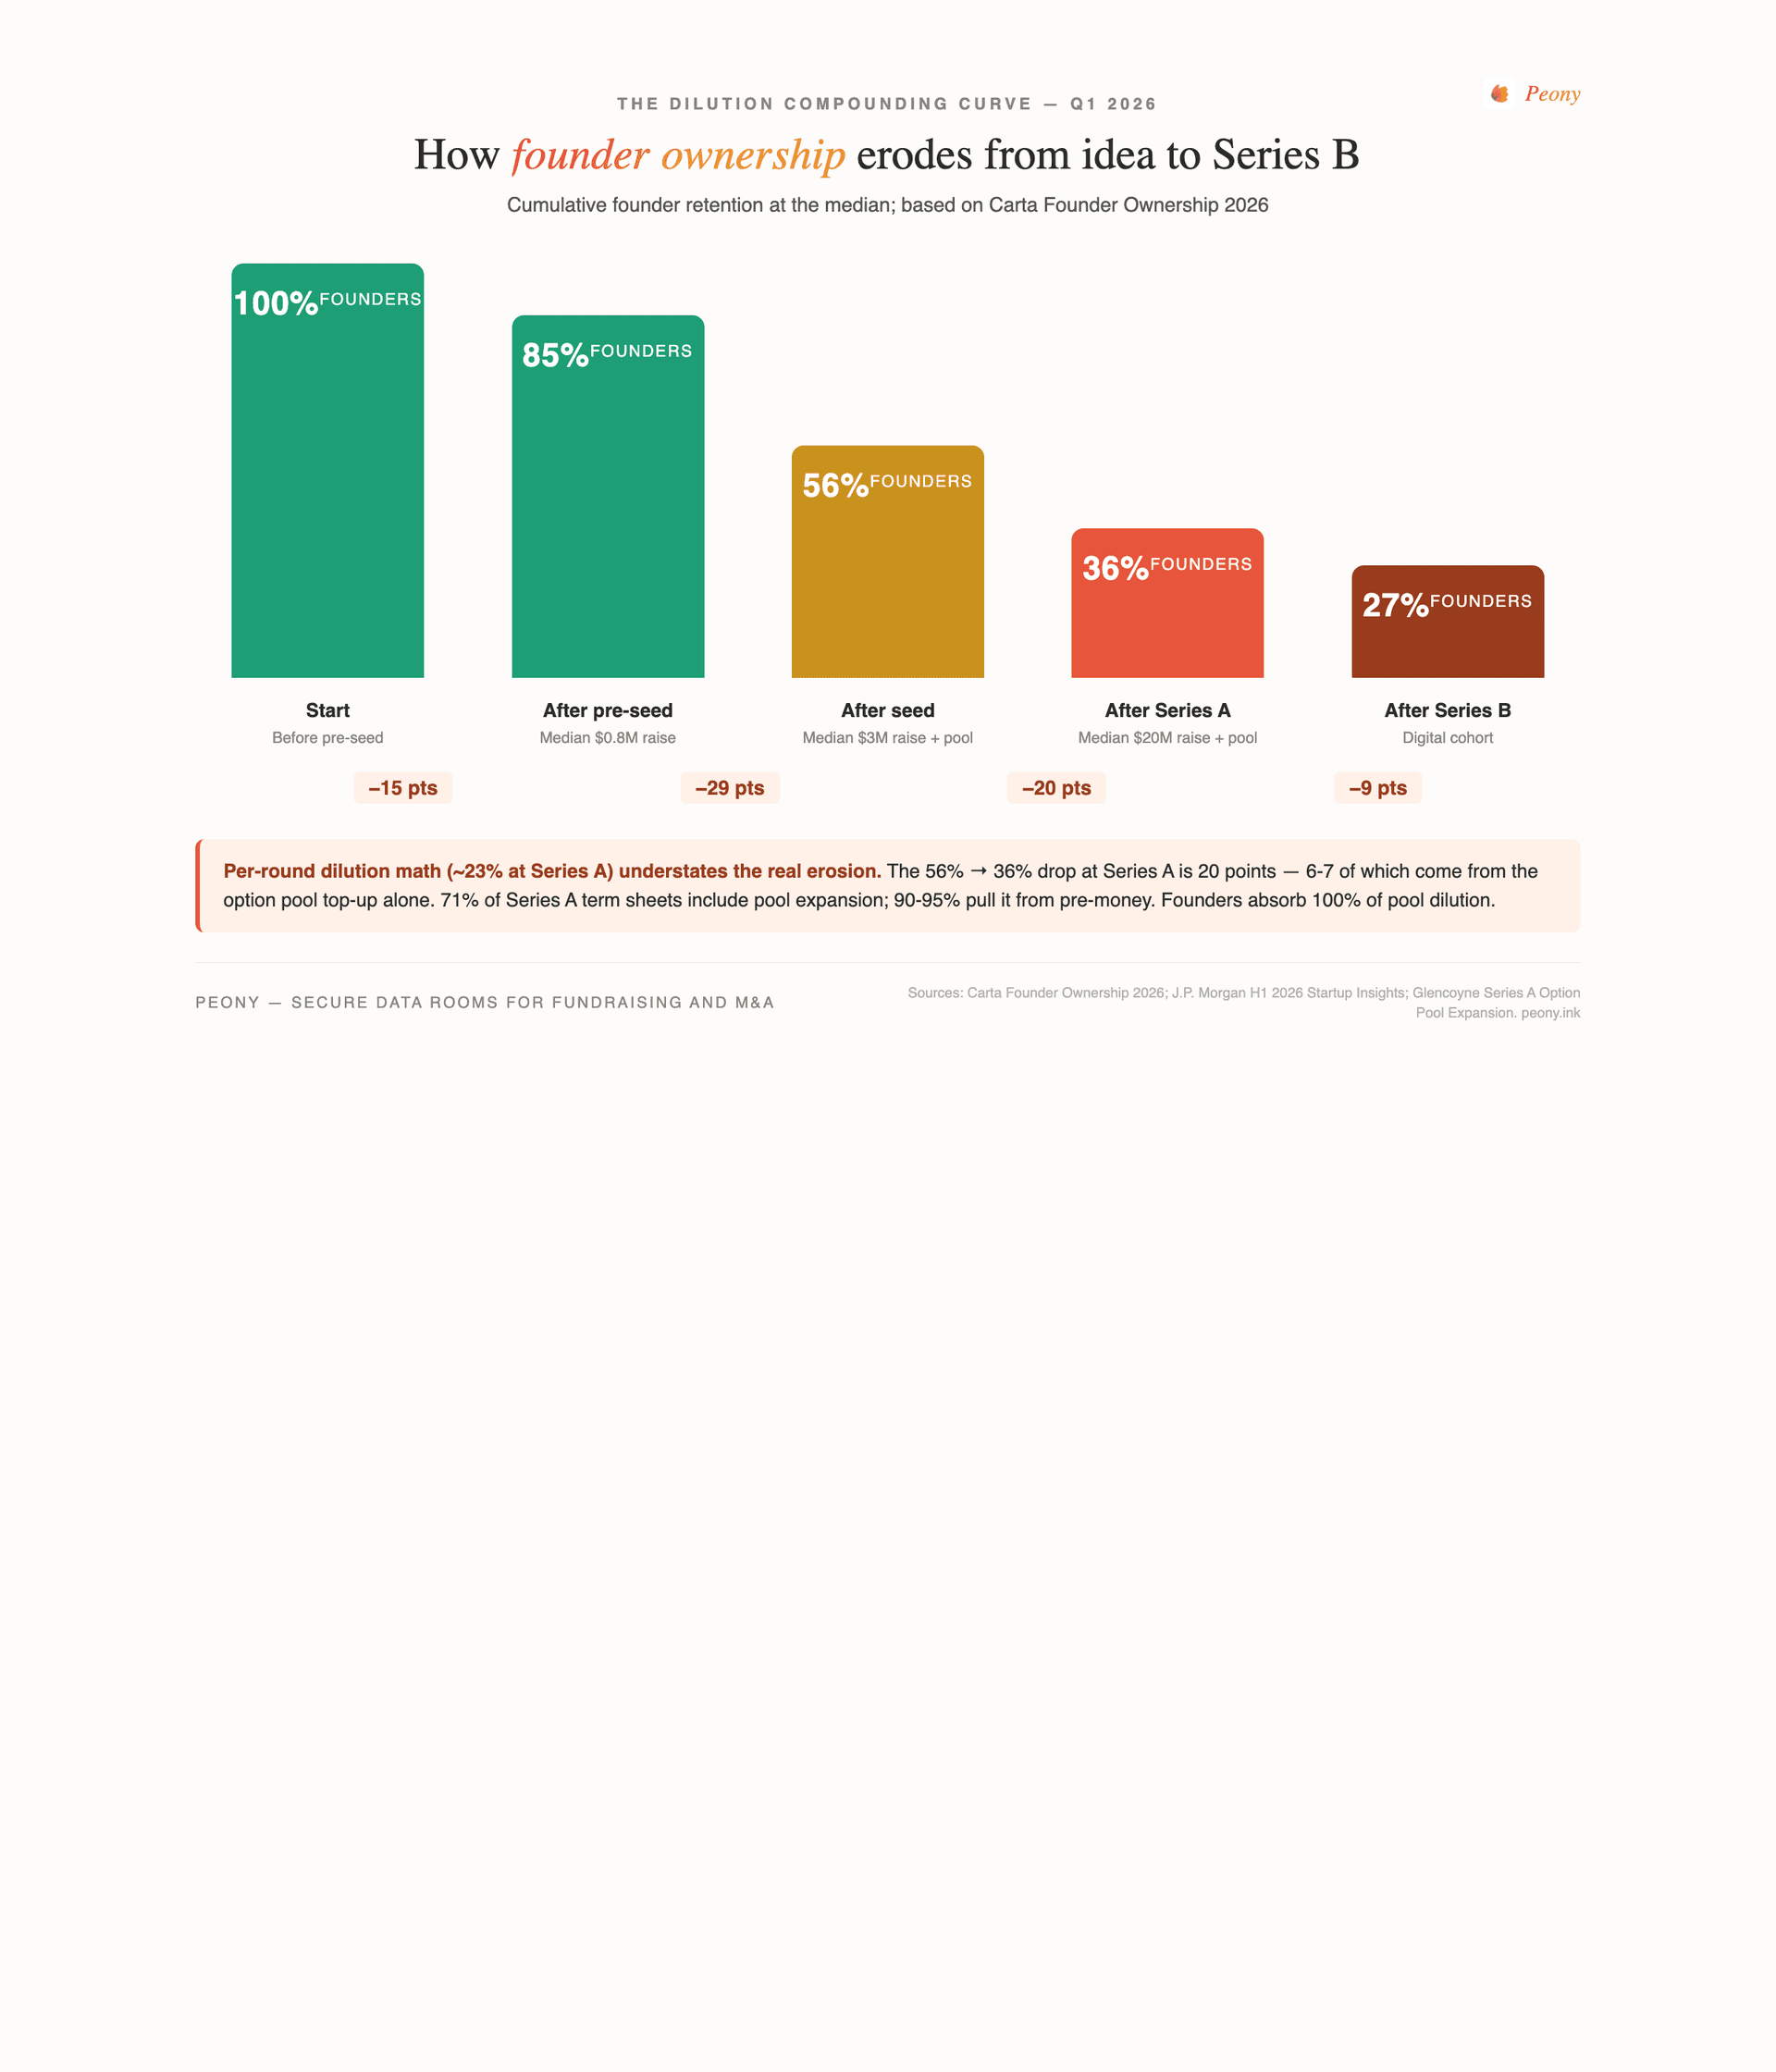
The 56% to 36% drop at Series A is 20 points, larger than the 23% headline per-round dilution number suggests. The extra 6-7 points come from the option pool top-up: 71% of Series A term sheets include a pool expansion, typically sized 15-20% post-money, and 90-95% of those expansions are pulled from pre-money — meaning founders absorb 100% of the pool dilution, with no offset from new investors.
Proprietary frame: Dilution Compounding Curve
Cumulative founder ownership erosion is not the sum of seed and Series A dilution — it compounds because option pools refresh at every round and anti-dilution clauses kick in at flat or down rounds. The "23% per round" stat hides the compounding. Starting at 100% and following the Carta-implied path, founders are at 56% post-seed and 36% post-Series A — a 64% total erosion of starting equity by the end of Series A, not the additive 46% the per-round math suggests. The hidden multiplier is the pre-money pool shuffle. When negotiating Series A term sheets, the option pool size and source (pre-money vs post-money shuffle) is often worth more to founder equity than the headline pre-money number. Targeting a 12% pool instead of 20% returns roughly 3 points of founder ownership at Series A — more than negotiating valuation 10% higher returns.
The lesson for founders is to model the pool expansion explicitly when comparing term sheets. A term sheet at $50M pre-money with a 20% post-money pool top-up taken from pre-money is materially worse for founders than a $45M pre-money with a 12% pool, even though the headline pre-money looks higher in the first case. Most founders only run the headline math.
How does sector affect Series A timing and deal size?
The sector divergence in Q1 2026 was extreme. J.P. Morgan's Series A medians by sector (Q1 2025 → Q1 2026):
| Sector | Q1 2025 median Series A | Q1 2026 median Series A | YoY change |
|---|---|---|---|
| AI | $15M | $22M | +47% |
| HealthTech | $14M | $17M | +21% |
| Life Sciences | $18M | $18M (flat est.) | ~0% |
| SaaS | $14M (est.) | $15M (est.) | +7% |
| Fintech | $14M (est.) | $14M (est.) | 0% |
The AI premium is the dominant force. Crunchbase reports that 80% of all global VC in Q1 2026 went to AI, and 41.7% of all seed capital in 2025 went to AI. The sector-wide AI seed premium versus non-AI peers is +42% on valuation and 1.3-times on median deal size. But these are the cohort averages — they do not capture the pedigree premium that distorts the top of the distribution.
AI and Life Sciences also raise faster than other sectors at Series A. JPM's Q1 2026 cohort analysis shows AI Series A timelines clustering around 14-18 months from seed; HealthTech is faster at 14-17 months; SaaS sits at 18-22 months; Fintech is the slowest at 20-24 months. Faster Series A timelines correlate with larger Series A rounds, which correlate with smaller seed-to-A step-ups (the elite cohort raises bigger seeds, hits Series A milestones faster, and dilutes less per round but more per dollar raised).
The named deals make the AI gap concrete. In Q1 2026 (and the months around it):
- Anthropic raised a $30B Series G at a $380B post-money valuation in February 2026 (led by GIC; co-led by Coatue, D. E. Shaw, Dragoneer, Founders Fund, ICONIQ, and MGX, with Microsoft and Nvidia participating).
- xAI raised a $20B Series E at a $230B valuation in January 2026 (Valor Equity, Stepstone, Fidelity, QIA, MGX, Baron Capital).
- Project Prometheus (Jeff Bezos + Vik Bajaj) raised $10B in April 2026 at a $38B valuation as a five-month-old company, with 120 ex-Meta/OpenAI/DeepMind employees pre-product. JPMorgan and BlackRock are among the participating investors (no formal lead was disclosed).
- Thinking Machines Lab (Mira Murati, ex-OpenAI CTO) closed a $2B seed at $12B post-money in July 2025 and is in talks for a follow-on at $50-60B valuation.
- SSI / Safe Superintelligence (Ilya Sutskever, ex-OpenAI co-founder) raised a $2B follow-on at a $32B valuation in April 2025 — six-times its $5B valuation from one year prior.
- Periodic Labs (Ekin Cubuk ex-DeepMind, Liam Fedus ex-OpenAI VP Research) raised a $300M seed at a $1.3B valuation in September 2025, then revalued to roughly $7B in follow-on talks in March 2026 — a 5.4-times valuation jump in six months.
- Humans& (ex-Anthropic, xAI, Google alumni) raised a $480M seed at $4.48B in January 2026.
- Unconventional AI raised a $475M seed at $4.5B in Q1 2026, having been founded two months prior (a16z and Lightspeed co-led, with Bezos, Lux, DCVC, Databricks, and Sequoia following).
- AMI Labs (Paris), founded by Yann LeCun (ex-Meta Chief AI Scientist, Turing Award winner), raised a $1.03B seed at a $3.5B pre-money valuation in March 2026 — the largest European seed round ever, with Bezos Expeditions, Cathay Innovation, Greycroft, Hiro Capital, and HV Capital co-leading.
For founders who are not in this cohort, anchoring to these rounds is a mistake. The sector-wide AI premium is 42% on valuation — meaningful but not 100-times. The pedigree premium is talent-specific.
Proprietary frame: AI Pedigree Premium
In Q1 2026, founder pedigree from a Tier-1 AI lab (OpenAI, Anthropic, DeepMind, Google AI) is priced into seed and Series A rounds as if it were $2-5B of implied valuation per alum on the founding team at no-product stage. This is a discontinuous jump from the cohort-wide 42% AI seed premium. The named pattern: Murati ($2B seed at $12B with no product), Sutskever ($32B at no product, six-times up in one year), Fedus + Cubuk ($300M seed → $7B in six months), Project Prometheus ($38B at five months old). Decision rule for non-pedigree founders: do not benchmark against these rounds when pricing your AI seed. Your benchmark Series A is the $22M median, not the $80M-plus tier. The pedigree premium is talent-specific, not sector-wide.
How does city affect Series A timing?
The geographic story is partially true. J.P. Morgan's Q1 2026 city analysis (Series A median size, Q1 2025 → Q1 2026):
| City | Q1 2025 median Series A | Q1 2026 median Series A |
|---|---|---|
| New York | $13M | $24M (+85%) |
| San Francisco | $14M (est.) | $20M-$24M (matched NY) |
| Boston | $12M (est.) | $15M (est.) |
| Austin | $11M (est.) | $13M (est.) |
| Los Angeles | $10M (est.) | $11M (est.) |
New York is the eye-catching mover — Series A medians up 85% in 12 months. The story behind that number is concentrated in AI and fintech: a small number of large NY AI rounds (and Renaissance-Pinnacle-style fintech rounds) pulled the median upward. San Francisco's pull came from the broader AI mega-round wave.
The Bay Area still dominates by volume. Per J.P. Morgan's city-level data, San Francisco proper accounted for 15% of all 2025 U.S. seed deals and 28% of U.S. seed dollars — bucking the declining trend across other cities. Crunchbase, using the broader Bay Area definition, reports the Bay captured roughly 45% of U.S. seed dollars in 2025 (up from 28% in 2023). The two numbers reconcile through definitions — SF city versus Bay Area — but both point the same direction: SF is the only major hub whose seed share is still growing. Density numbers (startups per square mile): SF 146, Paris 77, Chicago 39, Boston 30, NY 28, Seattle 13, London 12, Austin 6, Berlin 6, Miami 5, LA 5. Investor distribution mirrors the density: non-local capital participation runs SF 8%, Paris 12%, NY 27%, Berlin 29%, Austin 35%, London 38%, Boston 42%, LA 52%, Miami 60%, Seattle 65%, Chicago 75%. The Bay Area is the most self-funding ecosystem; secondary hubs depend more on visiting capital.
Where do timelines compress? In SF and NY, where investor density makes due diligence sprints faster and competitive pressure shortens negotiation windows. JPM's analysis indicates SF and NY companies close Series A roughly 1-2 months faster than companies in other hubs at comparable round sizes.
But the city effect on dilution is much smaller than the city effect on timing — which leads to the most counter-intuitive finding in the entire Q1 2026 dataset.
Why is location not driving dilution despite what people say?
The conventional wisdom — that Bay Area founders surrender more equity, that European founders preserve more — is incorrect once you control for the variables that actually matter.
J.P. Morgan's Q1 2026 regression of dilution on round size produces an R-squared of 38% — the largest single factor. Location, by contrast, is statistically insignificant. The myth survives because Bay Area founders cluster in capital-intensive AI sectors that drive dilution upward — but conditional on raising similar-sized rounds in similar sectors, San Francisco and Austin founders dilute similarly.
Carta's Founder Ownership Report 2026 reaches the same conclusion through a different lens: the sector retention gap is large (digital/SaaS 37.5% / physical 30.5% at Series A — a 7-point gap), but the city retention gap, holding sector constant, is within statistical noise.
Proprietary frame: Geographic Dilution Neutrality
Despite popular belief that "Bay Area founders give up more equity" or "European founders dilute less," location has no significant effect on dilution outcomes once you control for sector and round size. The myth survives because Bay Area founders cluster in capital-intensive AI sectors that drive dilution upward — but it is the sector, not the zip code. Founder HQ choice should be driven by talent, cost, and quality of life (where JPM's rankings favor Austin/Berlin/Chicago for cost; Seattle/Austin/Boston for QoL), not by dilution arbitrage. If a founder is choosing between SF and Austin for HQ, expect identical dilution on a same-sized round.
The practical decision rule for founders: do not pick a city to optimize dilution. Pick a city to optimize the talent pool you can hire from and the local investor base who will lead your seed. JPM publishes cost-of-living and quality-of-life rankings — Austin ranks first on cost-of-living (cheapest) and second on quality-of-life; Berlin is second cheapest; Seattle ranks first on quality-of-life. Bay Area and New York rank tenth and eleventh on cost. If you can lead a remote team, the dilution math will treat you the same.
What does a $10M+ coconut seed signal to Series A leads?
Coconut seeds are now common enough to have predictable structural implications. When a Series A lead reviews a deck from a founder who raised a $10M-plus seed, three signals fire:
-
Pedigree or category-creator positioning. The check size is justified by a OpenAI/Anthropic/DeepMind alum, a hot AI category (foundation models, neuromorphic compute, applied robotics), or sub-seed revenue traction. Without one of these, the round size triggers Series A skepticism.
-
Series A bar is now a 4-times step-up. Per the seed VC math, fund returns require a roughly 3-5-times mark-up at the next round. A $10M seed at $50M post requires a Series A at $200M-plus post — historically achieved by only 10-15% of the cohort. The cohort that raises a coconut seed and then fails to clear that hurdle is at risk of becoming a "zombie cap table" — fully funded but unable to progress.
-
Diligence depth flips early. Coconut seeds are diligenced at Series A standards — technical due diligence, customer references, audit-grade financial models. Founders who under-prepare lose 4-6 weeks resolving data room gaps.
The market is small enough that named patterns are still legible. Thinking Machines, SSI, Periodic Labs, Humans&, Unconventional AI, AMI Labs — these are all rounds priced by founder pedigree. The Cluely case is the cautionary counter-example: Cluely raised a $15M Series A from a16z in mid-2025 at a ~$120M post-money on a "viral consumer AI" thesis after a two-month seed-to-A graduation; in March 2026 CEO Roy Lee admitted the $7M ARR figure was inflated — the real number was $5.2M, a 35% gap, achieved by annualizing the best single month, counting committed-but-unsigned pipeline as revenue, and treating annual prepaid contracts as 12-months-of-ARR on day one. Top-decile speed and price are achievable, but the diligence cuts both ways — verification at top-decile speed is harder, and the same pedigree-and-narrative engine that gets a deal closed can mask thin underlying truths.
How concentrated is seed capital in Q1 2026?
The concentration trend has steepened every year since 2019. The five-year arc:
| Year | Top 10 seed deals (% of total seed $) | Top 100 seed deals (% of total seed $) |
|---|---|---|
| 2018 | ~6% | ~12% |
| 2020 | ~8% | ~15% |
| 2022 | ~12% | ~22% |
| 2024 | ~14% | ~26% |
| 2025 | ~17% | ~31% |
Reading the chart, capital is concentrating to the top at roughly 2-3 percentage points per year on both axes. Crunchbase's view through a different lens reaches the same destination: the top 629 companies that raised $100M-plus globally captured roughly 60% of all 2025 VC, and the top 68 companies that raised $500M-plus captured over 33% — up from 24% in 2024.
The mechanic behind the concentration is that mega-rounds reach $100M-plus valuations in fewer financing rounds than they used to. JPM's 2026 data shows the average number of rounds to reach $100M-plus has fallen from 3.4 (in 2020) to 2.6 (in 2025). The trajectory of a "successful" startup has compressed — fewer rounds, bigger checks per round, faster path to unicorn status. This is the underlying cause of the bimodal Series A velocity discussed earlier.
What this means for LPs and seed-stage VCs is a separate story, beyond the scope of this post but worth noting: as the median seed graduate's path to Series A lengthens and the elite track's path shortens, the IRR distribution for seed funds widens. Funds that catch the top 10 deals have outsized returns; funds that miss the top 10 face a longer DPI tail.
For founders, the practical implication is more direct: assume the Series A market you are competing for is smaller than the headline numbers suggest. If 55% of seed capital went to the 9% of seeds above $10M, the remaining 45% of seed capital — the median market — is competing for roughly the same dollars it had in 2022, with a higher graduation hurdle.
How does the AI pedigree premium distort the founder benchmark?
The AI premium is not one number — it is two regimes that have decoupled.
Regime 1: The cohort-wide AI premium. Across all AI seed startups (the wide pool), the median seed deal is roughly $4.6M versus $3.0M for non-AI seeds — a 53% deal-size premium. AI seed valuations run roughly 1.6-times non-AI post-money. Cohort-wide AI Series A median ($22M) is +47% over the prior year — fast growth, but still a normal sector trajectory.
Regime 2: The AI pedigree premium. For founders coming out of OpenAI, Anthropic, DeepMind, Meta AI, or Google AI with a high-profile track record, valuations have decoupled from the rest of the cohort. The named pattern in the months around Q1 2026:
| Company | Founder pedigree | Seed (or seed-like first round) | Valuation |
|---|---|---|---|
| Thinking Machines Lab | Mira Murati (ex-OpenAI CTO) | $2B | $12B (pre-product at close) |
| Safe Superintelligence (SSI) | Ilya Sutskever (ex-OpenAI co-founder) | $2B follow-on | $32B (no product, 6.4-times up in 12 mo) |
| Periodic Labs | Liam Fedus (ex-OpenAI VP Research) + Ekin Cubuk (ex-DeepMind) | $300M seed @ $1.3B | $1.3B → ~$7B in 6 months |
| AMI Labs (Paris) | Yann LeCun (ex-Meta Chief AI Scientist) | $1.03B | $3.5B pre-money |
| Humans& | ex-Anthropic, xAI, Google alumni | $480M | $4.48B |
| Project Prometheus | Jeff Bezos + Vik Bajaj + 120 ex-Meta/OpenAI/DeepMind | $10B | $38B (5 months old) |
| Unconventional AI | Naveen Rao (ex-Databricks CEO) | $475M seed | $4.5B |
| World Labs | Fei-Fei Li (ex-Stanford / Google AI) | $1B (multi-round) | Multi-billion |
The implied per-alum premium is roughly $2-5B in valuation for Tier-1 alumni on the founding team at no-product stage. This is a discontinuous jump from the 1.6-times cohort-wide multiple. For a non-pedigree AI founder, the trap is to read the headline rounds and benchmark against them.
Proprietary frame: Mega-Seed to Series A Step-Up Hurdle
Every seed valuation creates an implicit Series A floor that your traction must clear. The relationship in 2026 is roughly: Series A post-money must equal 3-5-times seed post-money to give seed investors VC-grade returns. The 2026 medians imply a 3.0-3.7-times step-up (seed $21-24M post / Series A $64-78M post). For top-decile seeds at $50M-plus post, the Series A bar is $150-250M-plus post — only ~10-15% of the cohort clears it. Decision rule: multiply your seed post-money by 4. If your 18-24 month forward business plan cannot justify that Series A valuation against industry comps, lower your seed valuation. A modest $15M-post seed that graduates to a $60M Series A is a better outcome than a $30M-post seed that graduates flat or stalled.
Why do biotech and hardware founders surrender more equity?
The sector dilution gap is the second-strongest predictor of founder retention after round size. Carta's Founder Ownership 2026 data:
| Sector cohort | Founder retention at Series A | Founder retention at Series B |
|---|---|---|
| Digital / SaaS / AI | 37.5% | 27.3% |
| Physical / industrial / biotech | 30.5% | ~22% |
The 7-point gap at Series A widens further at later rounds. The drivers:
-
Capital intensity. Biotech needs to fund FDA milestone gates — typically 2-3 tranches of capital with pool top-ups between. Hardware needs to fund prototype-to-production cycles with capex. Both require larger rounds to fund the same number of months of operation, which translates directly to more dilution per round.
-
Multi-stage financing structures. Life sciences rounds often include staged tranches tied to milestones (IND filing, Phase 1 readout, etc.), each of which can trigger a separate dilutive event.
-
Lower revenue leverage. Software founders can demonstrate traction with ARR and customer retention; biotech founders can demonstrate traction only with regulatory progress, which is binary. This asymmetry favors investor leverage in pricing.
-
Different exit dynamics. Biotech exits often happen earlier (Phase 2 license-out to pharma) and at lower revenue multiples. Investors price this into the dilution they require upfront.
J.P. Morgan's own observation that "life sciences/biotech experience structurally higher dilution" matches Carta's sector cuts exactly. The counter-mover is revenue-based financing: in digital health, Qubit Capital and others have started to substitute non-dilutive capital for some Series A dollars. For physical-industry founders, the practical mitigation is to negotiate milestone-based tranches, secondary sale right-of-refusal, and dual-class share structures upfront — software founders can afford to be passive on these terms, biotech founders cannot.
Proprietary frame: Sector-Dilution Premium
A founder's sector predicts dilution outcomes more strongly than any lever except round size. Digital and AI founders retain roughly 7 points more equity than physical and biotech founders at Series A — and the gap widens at later rounds. Drivers: capital intensity, staged regulatory financing, lower revenue leverage. Decision rule: physical-industry founders should plan for ~9% lower retention by Series A and negotiate harder for milestone-based tranches, secondary sale right-of-refusal, and dual-class share structures upfront. Software founders can afford to be relatively passive on these terms.
How should your data room scale with round size?
The composition of a fundraise data room scales with round size, not stage label. A $10M coconut seed faces Series A-level due diligence even if it is technically a seed. A $0.8M pre-seed needs almost no data room — a pitch deck and a 2-year financial model suffice. The biggest mistake we see at Peony is founders over-engineering pre-seed data rooms (wasting 4 weeks on a 60-document room that no one will read) and under-engineering Series A rounds (rushing into diligence with gaps that take 6 weeks to fill).
The Q1 2026 readiness matrix:
| Round size | Median raise | Data room depth | Required categories |
|---|---|---|---|
| Pre-seed | $0.8M | Deck + 5-7 docs (no full DR) | Deck; 2-yr financial model; cap table snapshot; founder bios; vision statement |
| Seed median | $3M | Light DR (15-25 docs) | + first customer references; product roadmap; 3-yr model; KPIs |
| Top-quartile seed | $6M+ | Standard DR (30-40 docs) | + traction dashboard; team breakdown; IP filings; competitive landscape |
| Series A median | $20M | Full DR (50-80 docs) | + signed customer contracts; QoE prep; security policies; HR policies; full cap table; compliance attestations |
| Coconut seeds & $30M+ Series A | $30M+ | Investor-grade DR (80-120 docs) | + technical due diligence; data privacy audit; recent financial audits; board minutes; SOC 2 type II; insurance docs |
Proprietary frame: Data Room Readiness by Stage
The composition of a fundraise data room should scale with round size, not stage label. A $10M coconut seed faces Series A-level diligence. A $0.8M pre-seed needs a pitch and a model, not a full DR. Investor expectations now decouple from stage label (per "Coconut Seed Signal" above), so under-prepared founders lose 4-6 weeks resolving DR gaps mid-process. Decision rule: size your DR depth to round size, not stage label. If you are raising at top-decile size, prepare a top-decile DR before approaching investors.
The structural elements of a Series A-ready data room — what investors actually look for — are documented in our Data Room for Investors deep dive and the Pitch Deck to Data Room conversion guide. The short version: a Series A DR is organized around the diligence questions investors will ask, not the files you happen to have. Investors do not want a folder labeled "Legal" with 35 PDFs dumped in it — they want a Cap Table folder with cap-table-current.xlsx, cap-table-fully-diluted.xlsx, SAFE-converted.xlsx, option-plan.pdf, and side-letter-summaries.pdf each in its own place.
Engagement analytics on the DR side are how leads communicate readiness back to founders. The most-viewed files in a Peony VDR during a Series A diligence sprint are nearly always (1) the financial model, (2) the customer contract list, (3) the cap table, and (4) the security questionnaire. Founders who track which files investors actually open can pre-empt the next round of diligence questions before they get asked.
What does this mean for your fundraising plan in 2026?
Five practical implications follow from the Q1 2026 data:
1. Anchor on the median, not the average. Seed median is $3.0M. Series A median is $20M. The averages ($7.3M and $43M) are correct but distorted by mega-rounds. For benchmarking, use medians.
2. Plan for 24+ months of seed runway if you are not on the Elite Track. The Carta graduation rate at 24 months has halved since 2018. Default to 24+ months of runway between seed and Series A unless you have AI-pedigree, $1M+ ARR, or 3-times YoY growth signals.
3. Model the dilution compounding, not the per-round number. Founder ownership erodes from 100% to 56% (post-seed) to 36% (post-Series A) — a 64% total erosion, not the 46% the per-round math suggests. Pool top-ups at Series A are the biggest hidden multiplier.
4. Pick HQ on talent and cost, not dilution. Location does not move dilution after you control for sector and round size. Austin is the cheapest hub; Seattle ranks first on quality of life; SF and NY have the deepest investor networks and the fastest Series A timelines.
5. Size your data room to the round, not the stage. A $10M coconut seed faces Series A diligence. Pre-seed rounds need only a deck and a model. A $20M Series A median round needs 50-80 documents organized by diligence question.
Where does Peony fit (and where it doesn't)?
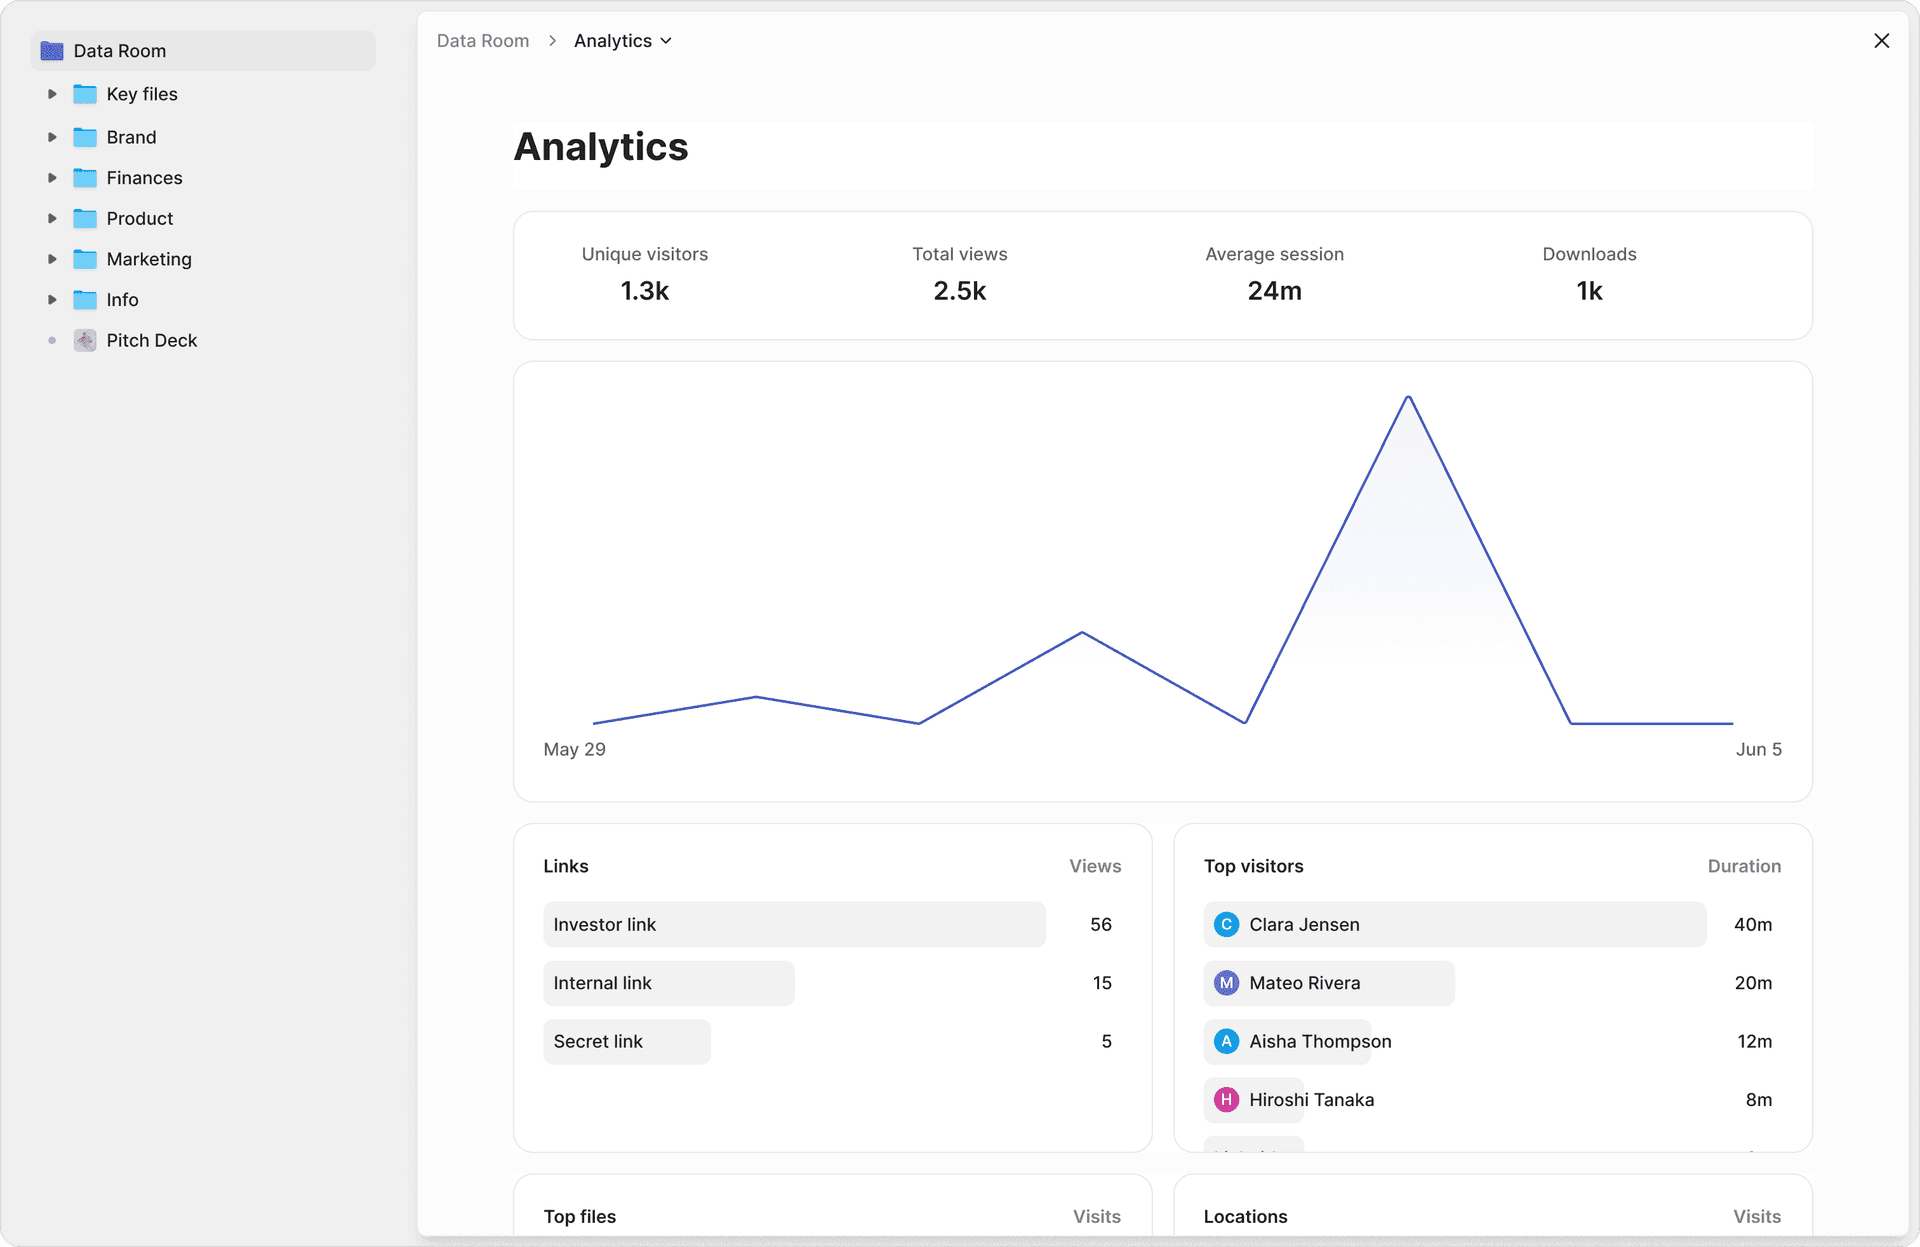
Peony builds the data room layer that founders use during fundraising and that investors use during diligence. We have served 5,900-plus deal teams across pre-seed through Series C — and the data we see on what investors actually open, how long files stay open, and what triggers follow-up questions is what informs the proprietary frames in this post.
Where Peony fits: founders raising seed through Series B who need a clean, fast, modern data room that handles 50-100 documents, granular permissions per investor, and engagement analytics. Particularly strong fit for AI/SaaS founders raising $3-30M rounds where the diligence sprint is compressed.
The investor side gets per-investor link control and engagement signals — you can see who has opened the financial model, who has spent 14 minutes on the cap table, and who has only briefly clicked into the security folder. Diligence becomes a conversation about evidence, not a series of email back-and-forths chasing signed NDAs.
Where Peony does not fit: foundation-model AI mega-rounds ($1B+ raises) where the full DR is custom-built with bespoke security stacks; pure pre-seed pitches where a Google Drive folder is sufficient; or M&A diligence above $200M deal size where Datasite/Intralinks legacy VDR features dominate.
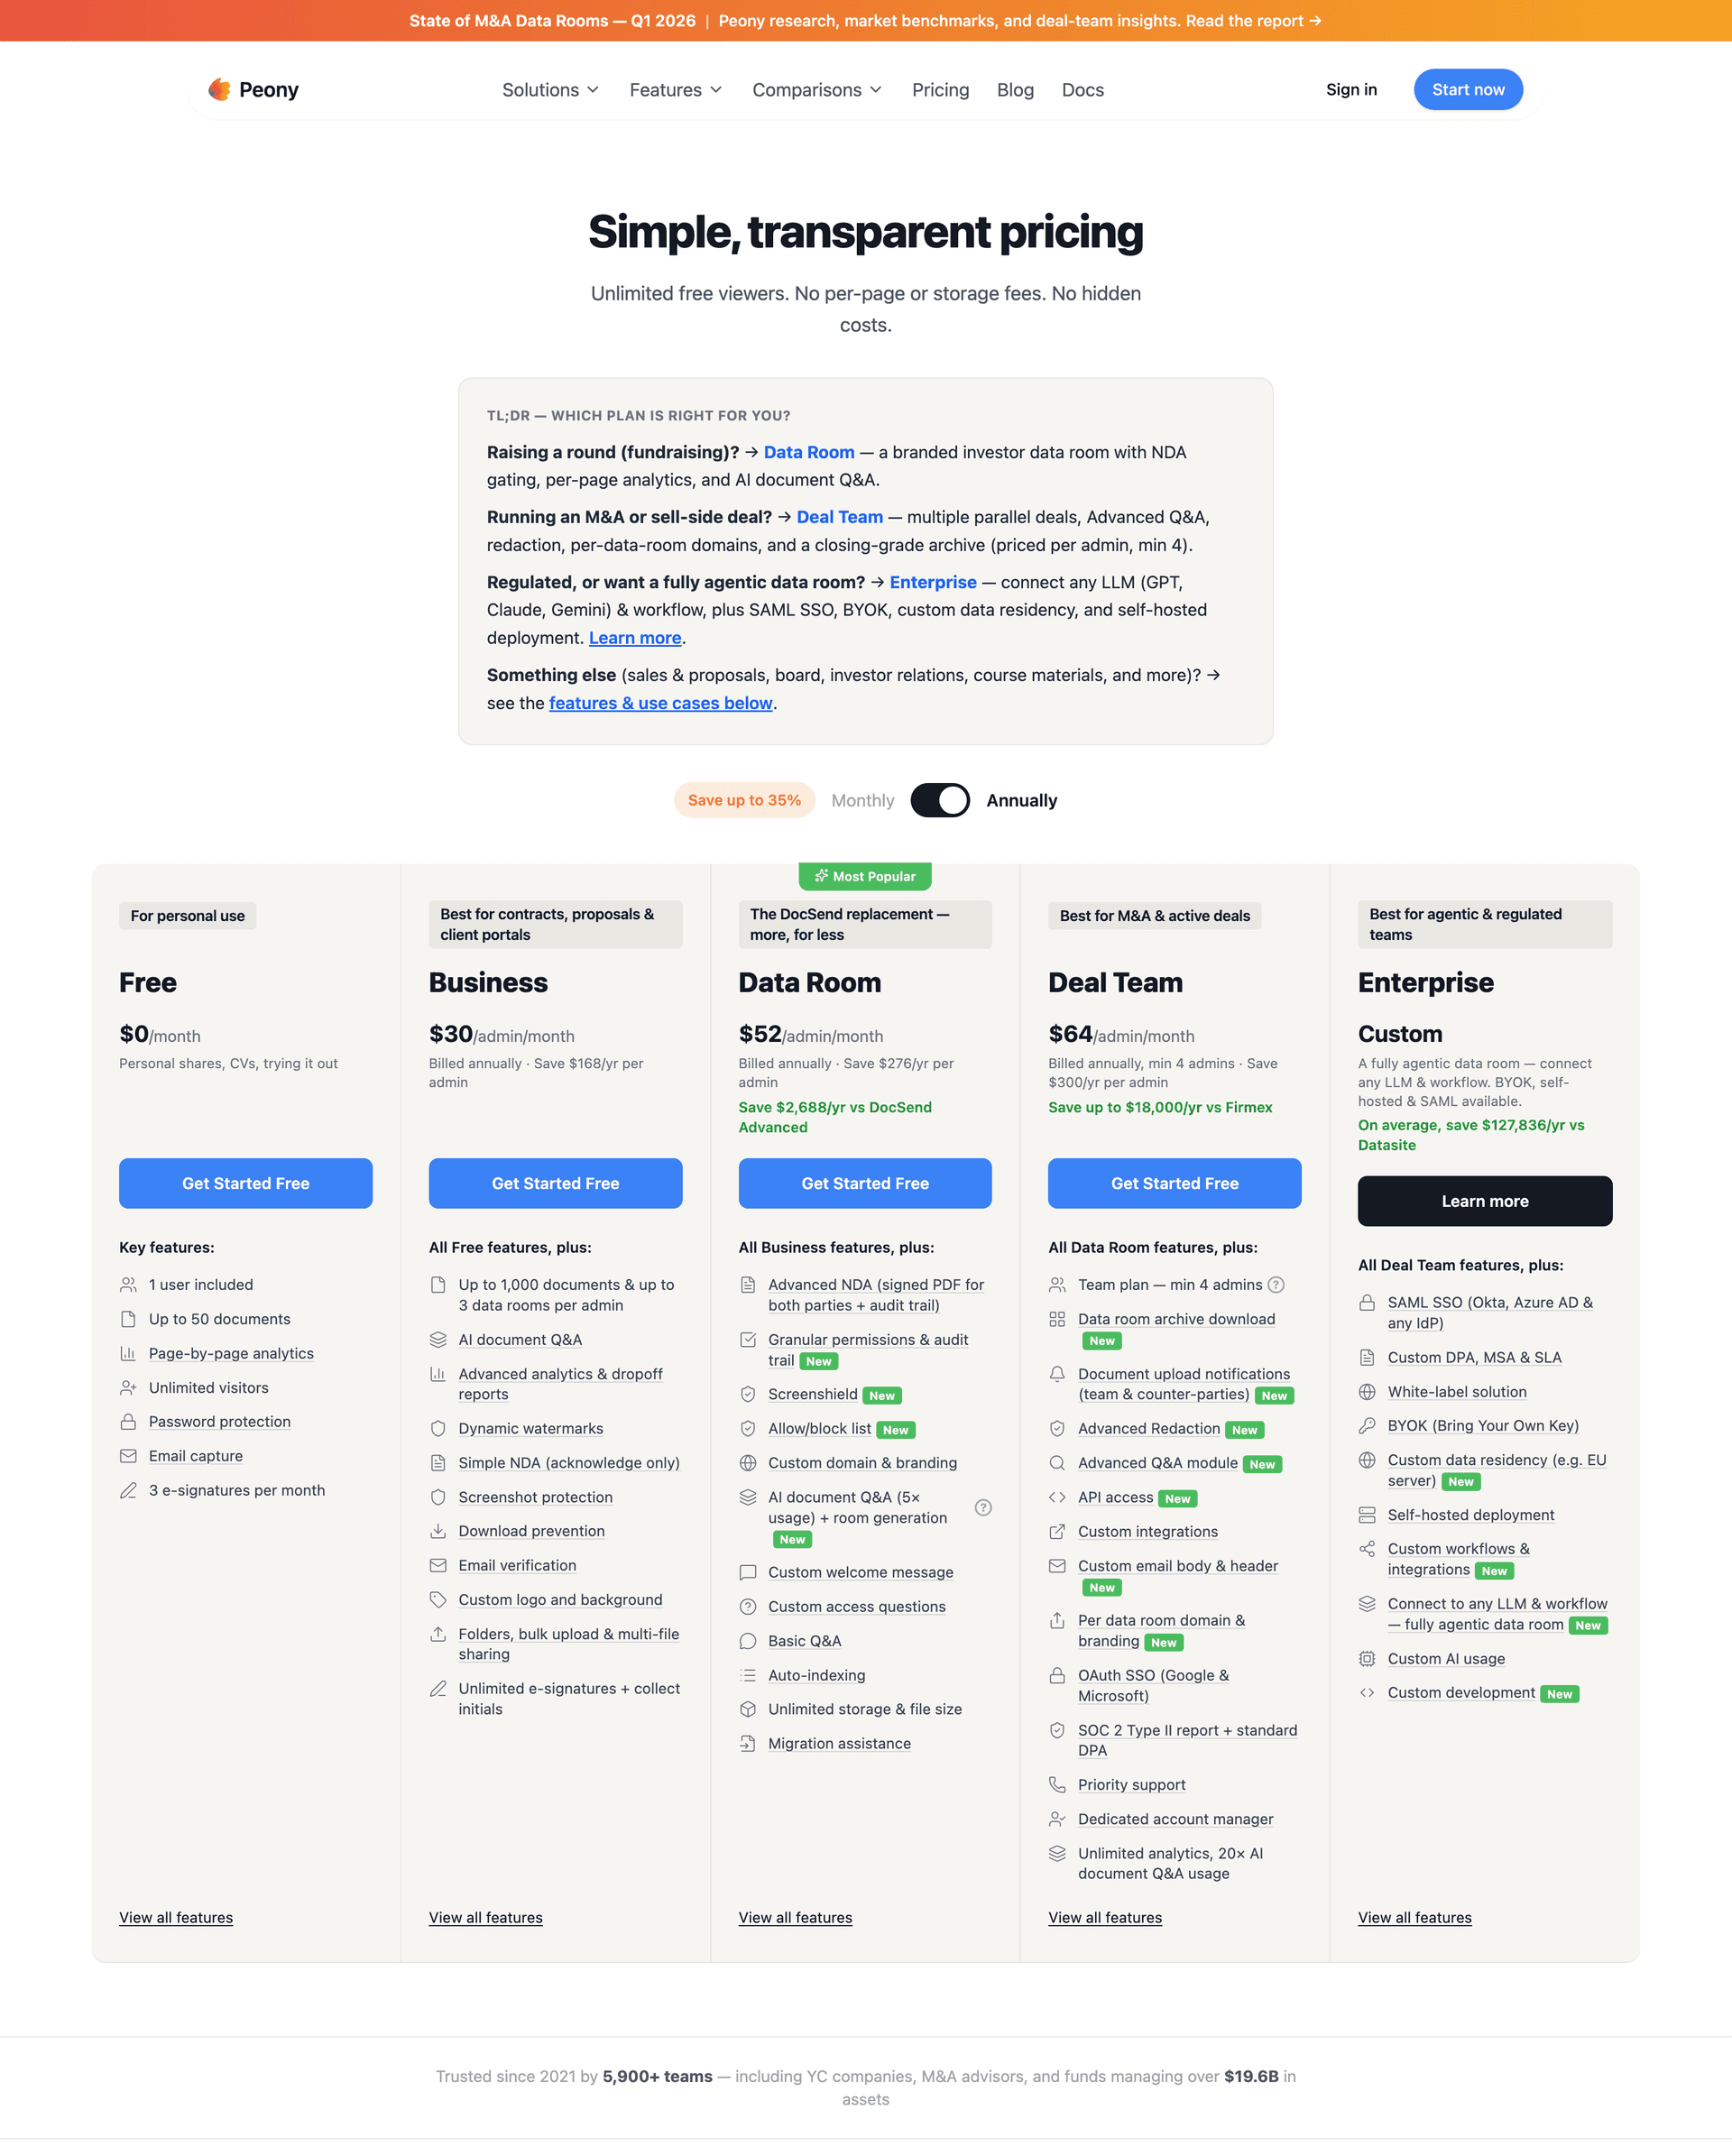
For pricing and tier details, see our pricing page — startup-friendly tiers begin below most legacy VDR comparison points.
Bottom line
Q1 2026 was the largest VC quarter on record by total dollars deployed — but excluding the top 5 mega-deals (Anthropic, xAI, Project Prometheus, OpenAI tranches, Waymo), the underlying market looks roughly flat. Concentration is the whole story. Seed median is $3.0M, Series A median is $20M, Series A dilution median is 23%, and these three numbers will frame nearly every fundraising conversation in 2026.
The bigger lesson is that the headline benchmarks now hide a bimodal market. Elite Track founders raise larger rounds faster, retain more equity, and graduate from seed to Series A in 14-15 months. Grind Track founders take 22+ months, dilute more per round, and face a halved graduation rate. Most founders are on the Grind Track and should plan accordingly.
The 18-24 month rule of thumb is dead. The "Bay Area founders dilute more" myth is dead. The "AI premium is one number" simplification is dead. What replaces them is a richer picture: sector and round size drive dilution; pedigree drives coconut-seed valuations; the median seed graduates to Series A on a long-tail timeline that often never closes. Plan your raise to the medians, model the compounding dilution explicitly, and size your data room to the round you are actually raising — not the stage label your lawyer puts on the term sheet.
Frequently Asked Questions
What is the median seed deal size in Q1 2026?
Both J.P. Morgan H1 2026 Startup Insights and the PitchBook-NVCA Q1 2026 Venture Monitor put the U.S. seed median at $3.0 million in Q1 2026. The average is $7.3 million, distorted upward by a small number of mega-seeds. The 75th percentile is $6.0 million and the 90th percentile is $10.0 million.
What is the median Series A deal size in Q1 2026?
J.P. Morgan puts the Q1 2026 Series A median deal value at $20 million on a $49 million pre-money valuation, implying roughly 23% dilution in a single close. PitchBook reports $19.6 million for the same quarter. The Q1 2026 Series A average is $43 million, more than double the median because foundation-model AI rounds skew the distribution.
How much dilution should founders expect at Series A in 2026?
The J.P. Morgan Q1 2026 distribution shows the 25th percentile of Series A dilution at roughly 15%, the median at 23%, and the 75th percentile at 31%. Round size is the strongest single predictor — J.P. Morgan's regression of dilution on round size produces an R-squared of 38%.
Is the 18 to 24 month rule of thumb for fundraising still valid?
No. J.P. Morgan's Q1 2026 data shows time-to-Series-A is bimodal — $30 million-plus rounds closed in roughly 14 to 15 months from seed, sub-$10 million rounds took roughly 22 months. The seed-to-Series-A graduation rate within 24 months has halved from 30.6% (Q1 2018 cohort) to 15.4% (Q1 2022 cohort).
How concentrated is seed capital at the top of the distribution?
In 2025, the top 10 U.S. seed deals captured 17% of all seed capital and the top 100 captured 31% — both numbers roughly double their 2020 levels. Roughly 55% of seed capital in 2025 went to deals over $10 million, which were fewer than 10% of seed deals by count.
Does the city where a startup is based affect dilution?
No. J.P. Morgan's regression shows location is statistically insignificant once you control for sector and round size. The myth that Bay Area founders dilute more survives because Bay Area founders cluster in capital-intensive AI sectors that drive dilution upward — but conditional on the same sector and round size, San Francisco and Austin founders end up at the same retention.
What does a $10 million coconut seed signal to Series A investors?
It signals founder pedigree from a top AI lab, category-creator positioning, or pre-seed revenue traction — but it also raises the Series A bar to a roughly 4-times step-up. For non-pedigree founders, the cohort-wide AI seed premium is roughly 42% in valuation, not 100-times. The pedigree premium is talent-specific.
How should a fundraising data room scale with round size?
Size your data room to round size, not stage label. A typical pre-seed at $0.8M needs 5 to 7 documents; a seed at $3M needs 15 to 25; a top-quartile seed at $6M-plus needs 30 to 40; a median Series A at $20M needs 50 to 80; coconut seeds and $30M-plus Series A rounds face investor-grade diligence with 80 to 120 documents.
Related Resources
- Data Room for Investors — what investors actually look for in a Series A DR
- How to Convert a Pitch Deck to a Data Room — the bridge between deck and full DR
- Seed Funding Guide — how to actually run a seed round
- Startup Fundraising Strategy — the strategic principles that don't change
- Startup Fundraising Rounds Guide — pre-seed through Series C mechanics
- Inbound Fundraising Playbook — when investors come to you
- Pitch Deck to Data Room Conversion — narrative-to-evidence bridge
- Different Passwords Per Investor — investor-specific access controls
- Block Screenshots from Pitch Deck — pre-NDA deck protection
You might also like
Jun 25, 2026
Series A Data Room: The Step-Change Round Where Your Room Gets Graded (2026)
May 17, 2026
How to Convert Your Pitch Deck Into a Data Room: 5-Step Founder Sequence (2026)
Apr 7, 2026
Top 15 US VCs Leading Series A Rounds for Startups in 2026