
Hard vs Soft Due Diligence: A 5-Frame Working Playbook (2026)

Co-founder at Peony. Former M&A at Nomura, early-stage VC at Backed VC, and growth-equity / secondaries investor at Target Global. I write about investors, fundraising, and deal advisors from the deal-side perspective I spent years in.
Hard vs Soft Due Diligence: A 5-Frame Working Playbook (2026)
Quick answer: Hard due diligence is the documents and the math (financial, legal, tax, commercial). Soft due diligence is the people and the patterns (HR, culture, customer, brand, leadership). Hard DD lives mostly inside the data room. Soft DD mostly happens outside it — and that gap is where 50-75% of M&A deals fail to hit their integration targets per McKinsey's 2023 Global Survey on M&A capabilities. The framing traces to Harding and Rouse's April 2007 Harvard Business Review article "Human Due Diligence" — both authors were Bain partners at the time. The five frames in this playbook (Cost-of-Skipping Index, Integration Failure Triple, Hard-to-Soft Reading Order, Soft DD Trigger Matrix, VDR-Visible vs Off-Sheet) are how I decide what to diligence, when, and where the data room ends.
Last updated: May 2026
Why I wrote this
I have run buy-side and sell-side diligence on hundreds of deals across founder-led sales, PE recapitalizations, strategic acquisitions, and venture-stage exits. At Peony we now serve more than 5,900 customers, and the pattern that shows up in our 283-deal Q3 2025-Q1 2026 platform benchmark is the same pattern I have seen on every individual deal team I have worked with: buyers spend 80-90% of their DD budget on hard DD — Quality of Earnings, legal review, tax structuring — and treat soft DD as a footnote that gets done in the last two weeks before close. Then they take the impairment 18 months later.
The 2024-2026 data is unusually consistent on this. The most-quoted single statistic across McKinsey, KPMG, Bain, PwC, and WTW 2024-2026 publications: between 50% and 75% of post-merger integrations fail on cultural clashes. Yet McKinsey's own benchmark of senior M&A practitioners shows only 10-20% apply similar rigor to cultural DD as they do to financial DD. The gap between what kills deals and what gets diligenced is bigger than any other gap in the M&A workflow.
This post is the working playbook I would hand to a corp-dev associate, a PE deal partner, or a founder-CEO running sell-side prep. It is structured around five frames I have battle-tested across enough deals that I trust them as a starting point. Two of the frames (Cost-of-Skipping Index, Integration Failure Triple) are the gates I run pre-LOI to decide whether to invest in deeper soft DD. Two (Hard-to-Soft Reading Order, Soft DD Trigger Matrix) are the operational frames I run during DD itself. The fifth (VDR-Visible vs Off-Sheet) is the honest partition between what a data room does and what it does not — useful regardless of whether the VDR is Peony, Datasite, Intralinks, iDeals, or Firmex.
What is the difference between hard and soft due diligence?
Hard due diligence is the document-and-math workstream. The four classical pillars: financial DD (Quality of Earnings, working capital normalization, EBITDA quality testing, cash flow review), legal DD (corporate structure, contracts, litigation history, IP ownership, regulatory compliance), tax DD (federal/state/international exposure, sales tax nexus, transfer pricing, NOL utilization), and commercial DD (market sizing, competitive position, customer concentration, pricing power, pipeline quality). All four are quantitative and contractual. The questions they answer are the kind a CPA or a lawyer can audit against a document set: Does the EBITDA reconcile? Is the IP chain unbroken? Are the tax positions defensible? Is the customer concentration acceptable?
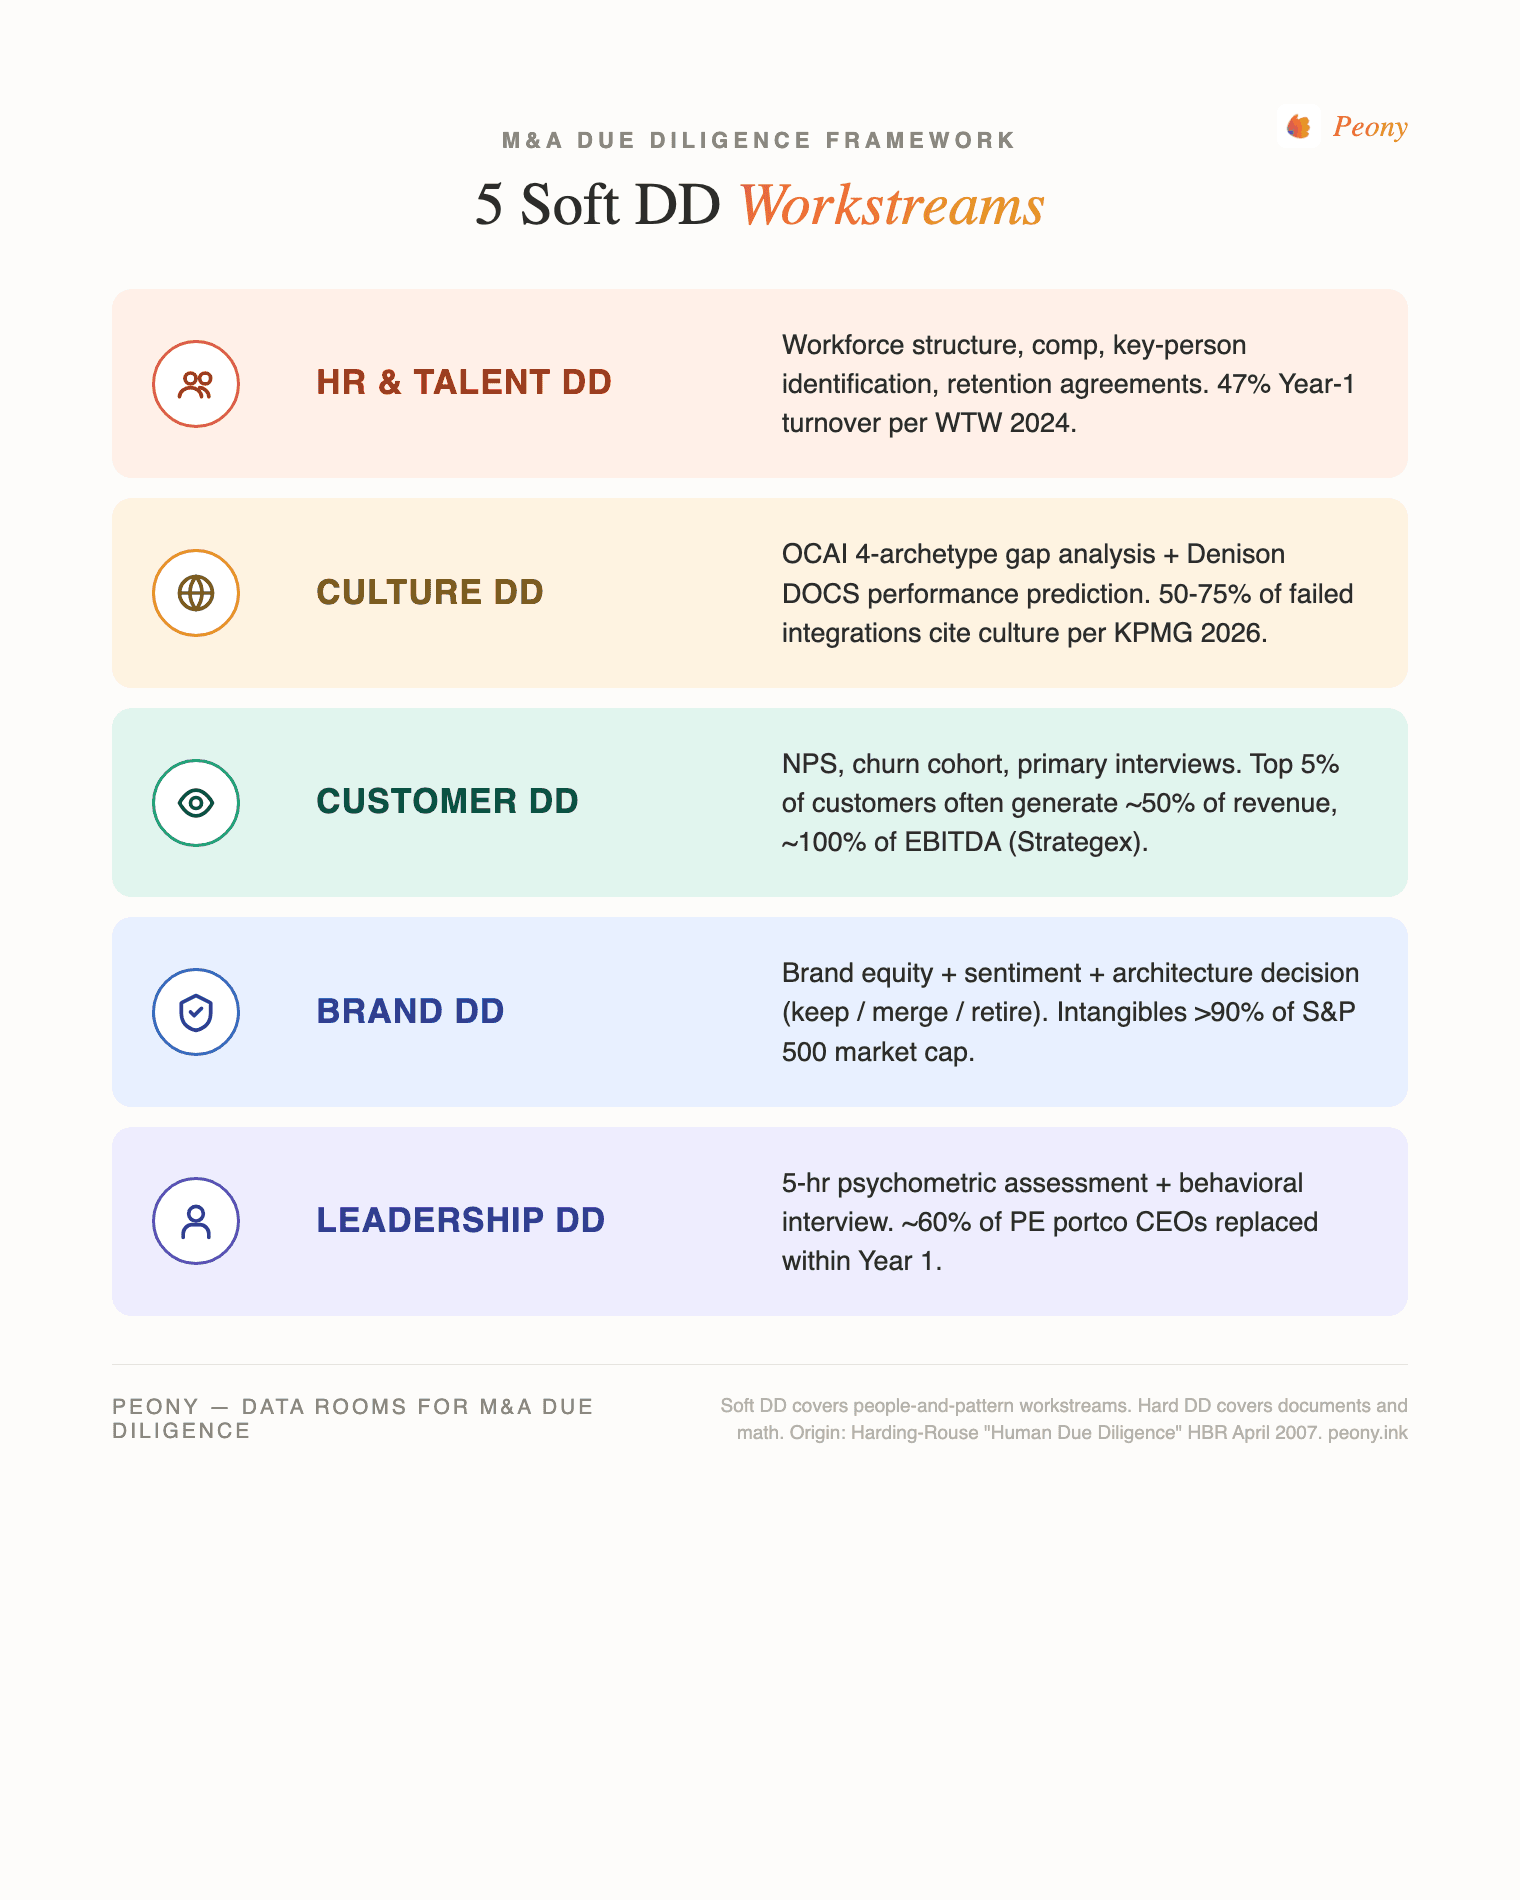
Soft due diligence is the people-and-pattern workstream. Five sub-pillars: HR/talent DD (workforce structure, compensation, key-person identification, retention plans), culture DD (organizational survey work, leadership-style alignment, decision-making norms), customer DD (NPS, churn cohort analysis, primary customer interviews), brand DD (brand equity, sentiment, architecture decision), and leadership/management DD (psychometric assessment, behavioral interviews, succession planning). All five are qualitative and behavioral. The questions they answer cannot be audited against a document: Will the top 20 engineers stay? Does the acquirer's hierarchical culture clash with the target's flat decision-making? Are the customers loyal to the product or to the founder?
The framing has a clean origin. David Harding and Ted Rouse published "Human Due Diligence" in the April 2007 issue of Harvard Business Review (R0704J), pages 124-131. Both were partners at Bain & Company at the time. The article introduced "human" or "people" due diligence as a peer workstream to financial DD — predating the explicit "hard vs. soft" framing that is now common across McKinsey, Bain, KPMG, PwC, Deloitte, and EY practitioner publications. The Bain/HBR co-authorship is why both Bain and HBR are cited as originators across modern soft-DD references.
The structural distinction that matters in 2026: hard DD is "VDR-visible." Every document a hard-DD workstream needs — audited financials, contracts, tax returns, customer lists, pipeline reports — lives in a virtual data room. The VDR is the natural substrate, and the workstream runs document-review-plus-Q&A. Soft DD is mostly "off-sheet." The artifacts come back to the data room (org charts, OCAI reports, leadership-assessment summaries, retention-plan drafts), but the work happens in clean-team interviews, executive assessments, customer reference calls, and primary-research engagements that no VDR performs.
Why does soft DD matter — what's the 2024-2026 data on integration failure?
The 2024-2026 data on integration failure is unusually consistent across the major DD publications. The headline range: M&A "failure-to-meet-objectives" rates run 70-90% per McKinsey, HBR, and BCG meta-studies. Long-run academic data from MIT Sloan shows 46% of S&P 500 M&A deals over 25 years are eventually undone — divested, spun off, or written down. Within those failures, 50-75% are attributable to cultural clashes per the cross-cited 2024-2026 KPMG, McKinsey 2023, PwC 2023, and Phoenix Strategy compilations.
The most actionable single statistic comes from McKinsey's 2023 Global Survey on M&A capabilities: when companies get culture alignment right during DD, they are >40% more likely to meet or surpass cost-synergy targets and up to 70% more likely to meet or surpass revenue-synergy targets. The same survey asked senior practitioners how rigorously they conduct cultural DD versus financial DD — only 10-20% reported applying similar rigor. The gap between what predicts deal success (culture alignment) and what gets diligenced with rigor (financial workstreams) is the largest single source of post-close value destruction in modern M&A.
KPMG's April 2026 Integration Gap Report sharpens the picture: 87% of leaders identify front-office integration (customer-facing, brand, sales) as a top priority, but only 5% have successfully delivered it — and integrated companies are 3x more likely to achieve higher revenue growth. PwC's 2023 M&A Integration Survey found >60% of acquirers now include cultural assessment in DD and make it part of the go/no-go decision, with 71% launching change-management initiatives before signing.
Post-merger turnover data anchors the soft DD case at the unit-level. The PMI Stack and E2E Deal Insights 2024-2026 compilations track 47% Year 1 turnover and 75% Year 3 turnover at acquired companies. Voluntary attrition rises >30% during M&A transactions. Approximately 33% of acquired employees leave post-acquisition when cultural integration is poorly handled. Around 30% of leadership departs in the first year — and at PE portcos, that figure climbs: approximately 60% of PE portfolio-company CEOs are replaced within Year 1 per Hunt Scanlon and Hogan Assessments.
The WTW 2024 M&A Retention Study shows acquirers are responding with bigger retention budgets — 72% now track or set aside fixed retention payments, with standard terms of 12-24 months. Median retention bonus is 75-100% of base salary for C-suite (the Paramount-Skydance precedent locked $1M / 100% as a marker), 50% for other senior leaders, 30% for rank-and-file. But CFO.com reports 28% of acquirers in 2024 still had no key-person retention plan at all. Nearly half of top performers leave within Year 1 post-close; up to 75% within Year 3.
Recent failed-deal case studies (2024-2026) keep the framing concrete. Walgreens took a $5.8B impairment on its VillageMD investment in Q2 2024, closing 160 of 680 clinics. Sony wrote down $765M on Bungie in 2026. The HP-Autonomy $8.8B write-down from 2011 remains the canonical cultural-failure case still cited across 2024-2026 analyses — HP's structured/hierarchical culture clashed with Autonomy's entrepreneurial mindset, trust broke down, and the deal was destroyed within twelve months. Daimler-Chrysler, Sprint-Nextel, AOL-Time Warner, Quaker-Snapple, and Microsoft-Nokia round out the standard culture-failure reading list across modern soft-DD publications.
What's in the hard DD scope — financial / legal / tax / commercial?
Financial DD reconciles reported EBITDA to normalized EBITDA. The mechanics: a Quality of Earnings (QoE) report identifies one-time items, non-recurring revenue, owner perks, related-party transactions, and accounting-policy normalization. Working capital normalization sets the "peg" — a target working capital level at close, with shortfalls deducting dollar-for-dollar from purchase price and excess added. The SRS Acquiom 2026 Working Capital Study covering 1,500+ deals and $385B in finalized PPAs shows working capital adjustments now appear in >90% of private-target M&A (up from ~50% a decade ago). Working capital escrow is typically ~1% of transaction value, held 60-90 days post-closing. The 2025-2026 lender standard: 84% of lenders now require detailed documentation for all QoE adjustments and normalized EBITDA analysis per DueDilio's 2025 QoE Analysis Guide.
Legal DD takes 2-6 weeks (longer for cross-border) and covers six scope areas: corporate structure (cap table, governance, board minutes), contracts (anti-assignment, change-of-control termination rights, material customer/vendor terms), litigation (pending and threatened, employment claims, IP disputes), IP ownership (assignment chains, work-for-hire agreements, registrations), regulatory compliance (industry-specific licensing, export controls, privacy), and employment law. The most common 2024-2026 red flag from Herrera Partners and Bloomberg Law's M&A DD Checklist: missing or unsigned IP-assignment chains where contractor-built code or product IP lacks work-for-hire agreements (especially in startup and tech acquisitions). Findings flow into reps and warranties, indemnification baskets, purchase-price adjustments, and closing conditions.
Tax DD covers federal, state, and international tax exposure. Standard scope: corporate income tax, sales tax nexus (state-by-state Wayfair exposure on remote sellers), transfer pricing, NOL utilization, R&D credits, employment tax (1099 misclassification), and international tax (transfer pricing, BEAT, GILTI). R&W insurance interaction is central — 65% of M&A respondents expected R&W insurance use to rise in 2025 per CBIZ, and insurer coverage scope depends directly on DD rigor. Areas not professionally scrutinized get excluded from coverage. Tax liability insurance and contingent-risk insurance can cover known exposures that R&W typically excludes. Cybersecurity reps are now in 22% of 2026-cohort deals per SRS Acquiom — up from 5% in 2024, a 440% YoY growth — reflecting the broader trend of tech-and-data risk migrating into hard-DD scope.
Commercial DD covers market sizing, competitive position, customer concentration, pricing power, pipeline quality, and sales-cycle analysis. The headline red flag from Documind and Buxton's CDD checklist: any single customer >20% of revenue is a red flag. Top-5 concentration >50% triggers deeper customer interviews. Pipeline quality testing — what % of pipeline closes in the named quarter, what % converts to multi-year contract — is gating for SaaS and recurring-revenue targets. HSF Kramer's 2025 Global M&A Report flags that 43.2% of M&A professionals expect DD requirements to increase in the next 12 months, with commercial DD particularly scope-creep-prone.
All four hard-DD pillars consume documents. The VDR is the operating substrate: contracts, schedules, tax returns, customer lists, pipeline reports, financial statements, IP filings — all live in the room. Permissioning, audit trail, Q&A workflow, and AI-assisted indexing accelerate the workstream 3-5x compared to email-based DD. This is the primary value virtual data rooms deliver, and it is unambiguously where modern VDRs (Peony, Datasite, Intralinks, iDeals, Firmex, Ansarada) compete on equal footing.
What's in the soft DD scope — HR / culture / customer / brand / leadership?
HR / Talent DD covers workforce structure, compensation, benefits, compliance, culture, HR systems, and employment agreements (non-competes, IP assignments, change-of-control). The granular question that matters: not "will the CEO stay?" but "which individuals, if they left, would take customers with them?" That question requires interviewing a target's customers, salespeople, and account managers — work that no VDR performs. McKinsey's Talent Retention and Selection in M&A research shows acquirers that identify and target key employees within 30 days post-announcement are materially more likely to retain them. The WTW 2024 retention-bonus benchmarks anchor the cost-side: 75-100% of base for C-suite, 50% for senior leaders, 30% for rank-and-file, term 12-24 months. The standard FTC non-compete rule changes have shifted scope (see our HR DD guide for the post-Ban scope rebalancing). My field operating rule on HR DD: the soft-DD finding most likely to kill a deal is a single account manager who controls a customer relationship worth >10% of revenue and who has no retention path beyond their current at-will employment.
Culture DD uses two canonical instruments: OCAI (Organizational Culture Assessment Instrument) — a 6-question instrument where employees allocate 100 points across four culture archetypes (Clan, Adhocracy, Market, Hierarchy) — and Denison Organizational Culture Survey (DOCS) — 48 questions measuring four traits (involvement, consistency, adaptability, mission). OCAI is best for comparative gap analysis between acquirer and target. Denison is better for performance-alignment prediction. Best practice: deploy both. OCAI surfaces the deltas (acquirer is Market-Hierarchy, target is Clan-Adhocracy = high-mismatch flag). Denison predicts which deltas will harm performance. PwC's 2023 survey found >60% of acquirers now conduct some form of cultural assessment in DD, with 71% launching change-management initiatives pre-signing. The structural constraint is access — target won't grant pre-close access to employees for full surveys, so cultural DD typically combines outside-in research (acquirer assesses its own culture + outside data on target via Glassdoor, LinkedIn attrition, customer review sites) with limited clean-team interviews under NDA.
Customer DD uses NPS, churn cohort analysis, and primary customer interviews. The customer-concentration impact is large: per Strategex's 80/20 customer DD research, roughly 5% of customers often generate ~50% of revenue and ~100% of EBITDA. Weak NPS compresses valuation multiples by signaling customer-concentration risk. The 2025 benchmarks: NPS 30+ is healthy; 70+ is best-in-class. The B2B methodology blind spot: the same target can produce +82 weighted vs -14 unweighted depending on whether you weight by account size, contract value, or pure response count. Pre-LOI customer DD typically relies on the seller's first-party data (NPS surveys, churn cohort reports, customer-satisfaction scores). Post-LOI, primary customer interviews — typically clean-team coordinated, 8-15 interviews across the customer concentration distribution — test pricing power, switching triggers, and unmet needs per HSF Kramer's 2025 Global M&A Report.
Brand DD is the most-undervalued soft-DD workstream. Brand Finance data shows intangible assets are >90% of S&P 500 market capitalization — brand is a material asset class. Yet brand DD is "often overlooked" in DD across 2024-2026 publications. Scope: brand recognition, sentiment, equity, architecture decision (does the acquirer keep target's brand, merge them, or retire the target brand?). Best practice: integrate brand DD into target identification (pre-LOI), not as a late-stage afterthought. The brand-architecture decision should be made before signing or no later than close — leaving it for post-close integration typically destroys 20-40% of brand equity through messaging dilution and customer confusion. Methodology: Brand Finance, Interbrand, MBLM, and Kantar BAV are the standard 2024-2026 brand-valuation specialists.
Leadership / Management DD typically runs a 5-hour structured assessment per executive combining psychometric instruments (Hogan, Korn Ferry KF4D, Mercer assessment) plus behavioral interviews. The economic case is now well-established: 94% of GPs say PE portfolio-company leaders contribute ~53% of investment returns per Hunt Scanlon, and 43% of private investors have increased talent-DD scrutiny year-over-year. The methodology stack typically combines psychometric/behavioral assessment, qualitative interviews with the management team, culture-and-attrition pattern review, and reference calls with prior board members or co-investors. 69% of mega-funds use third parties for confidential management referencing versus only 33% of mid-cap funds — a structural gap between disciplines that creates the executive-replacement frequency (60% PE portco CEO turnover Year 1).
The soft-DD vendor stack consolidates around named specialists: Spencer Stuart, Heidrick & Struggles, Korn Ferry, ghSMART, Mercer, and Hogan for leadership/culture DD; Bain People & Org and McKinsey Org Practice for transformation-and-PMI-grade cultural DD; Vantage, Strategex, and PwC Customer Practice for primary customer DD; Brand Finance and Interbrand for brand DD; AIHR, Workhuman, and the major HRO partners for HR DD. None of these workstreams is replaceable by a VDR — they are interview-driven, instrument-driven, or both. What the VDR does is hold the artifacts that come out of them.
Frame 1: What does the Soft DD Cost-of-Skipping Index quantify?
The Cost-of-Skipping Index is the proprietary frame I use to translate "we should do soft DD" into "here is the dollar penalty if we don't." Each soft-DD workstream has a quantifiable failure-cost evidenced in 2024-2026 data — and that cost becomes the floor on what an acquirer should spend on that workstream pre-LOI.
| Soft DD workstream skipped | 2024-2026 evidence | Implied cost-of-skipping |
|---|---|---|
| Culture DD | 50-75% of failed integrations cite culture (KPMG/McKinsey 2024-2026); culture-aligned deals 40% more likely to hit cost synergies, 70% more likely to hit revenue synergies (McKinsey 2023) | ~40-70% synergy haircut on the deal model |
| HR / Key-person DD | 47% Year-1 turnover, 75% Year-3 turnover (PMI Stack 2024-2026); 28% of acquirers had no retention plan in 2024 (CFO.com) | ~50% of acquired headcount value at risk |
| Leadership DD | ~60% of PE portco CEOs replaced Year 1 (Hunt Scanlon, Hogan); 94% of GPs say leaders contribute ~53% of returns | 12-month productivity gap + executive-search cost per replacement |
| Customer DD | NPS swing from +82 weighted to -14 unweighted on the same target depending on methodology (Strategex); top 5% of customers often generate ~50% of revenue and ~100% of EBITDA per Strategex 80/20 research | 25-60% valuation multiple delta |
| Brand DD | Intangibles >90% of S&P 500 market cap (Brand Finance); brand "often overlooked" in DD per 2024-2026 surveys | Up to 90% of paid value tied to intangibles, much of it in brand |
The Cost-of-Skipping Index is not a calculator. It is a forcing function for the LOI-stage conversation about DD budget allocation. The default error I see in PE associate DD plans and corp-dev DD plans is over-investing in QoE rigor — $200K-$400K of QoE work — while leaving the cultural-DD line and the leadership-DD line at zero. The Index does not say to spend equally; it says to spend proportional to where the deal will fail. For a financial-engineering LBO with no operational thesis, QoE rigor at 80% of budget is correct. For a strategic-synergy acquisition where the thesis is people-mediated cost takeout, culture + leadership DD should be at 30-40% of the soft-side budget, not at zero.
The pricing benchmark I use as a floor: leadership DD costs $15K-$50K per executive assessed. A 5-executive top-team assessment costs $75K-$250K total — less than 0.5% of a $50M deal, and less than 0.05% of a $500M deal. Cultural DD via OCAI plus targeted clean-team interviews runs $30K-$150K per engagement. Customer DD interviews run $25K-$100K for 10-15 interviews. The total soft-DD budget on a $50M-$500M deal should be $200K-$500K as a starting point — small money against a 70% failure rate.
Frame 2: What's the Integration Failure Triple and how do I screen for it?
The Integration Failure Triple is a pattern-recognition frame: when all three of the following are present in a target, integration failure probability spikes.
-
Culture mismatch — acquirer and target diverge on at least two of the four OCAI archetypes (e.g., acquirer is Market-Hierarchy, target is Clan-Adhocracy). This shows up in decision-making style, hiring norms, performance management, and meeting cadence. Even if the deal economics work, day-to-day collaboration friction destroys the synergy model.
-
Key-person flight risk — one or more individuals would take >10% of revenue with them if they departed, AND those individuals are not under a retention package that survives the deal close. This is the structural variant of HR DD's "which individuals control customer relationships?" question. The risk is not generic turnover. It is specific revenue-tied departure.
-
Customer concentration shift — top 5 customers >50% of revenue AND those customers' loyalty is tied to founders or specific account managers, not to the brand or product. This is the variant of commercial DD's customer-concentration test, but with the soft-DD overlay: the question is not "is the customer concentration high?" — it is "is the customer loyalty transferable to a new owner?"
When all three are present, the deal will likely match the canonical failure pattern: HP-Autonomy ($8.8B write-down, 2011), Daimler-Chrysler, Sprint-Nextel, AOL-Time Warner, Quaker-Snapple, Microsoft-Nokia. Recent 2024-2026 examples include Walgreens/VillageMD ($5.8B Q2 2024 impairment, 160 of 680 clinics closed) and Sony/Bungie ($765M 2026 write-down).
The Triple gates one of three actions:
- Deeper soft-DD scoping — $200K-$500K of culture + leadership + customer interviews to confirm or refute each leg of the Triple.
- Deal repricing — synergy haircut of 30-50% in the deal model to reflect the elevated integration-failure probability, applied as either a price reduction or a larger retention escrow.
- Walk away — if all three legs are confirmed and the deal thesis depends on integration-driven synergies, the deal probably destroys value at any price.
The Triple is not a checklist — it is a Bayesian prior. Two of three present is a warning. Three of three is a stop sign. The most useful operational signal: when an LOI-stage deal team can answer two of the three questions with hard data (customer concentration, OCAI gap) but cannot answer the third (key-person flight risk), that is the soft-DD line item that needs the most investment.
The Triple is also asymmetric. The absence of cultural mismatch is rarely a leading positive signal — most acquirer-target pairs have some culture delta. The presence of all three legs is a leading negative signal, however, because it predicts the specific failure mode (synergy collapse via people-mediated friction). I have used the Triple as a kill-criterion on three of the last twelve deals I evaluated where the deal economics looked clean but the soft-DD signals lined up.
Frame 3: How should deal thesis re-order the DD table of contents (the Hard-to-Soft Reading Order)?
The default DD table of contents — financial, legal, tax, commercial, then HR, culture, customer, brand, leadership — is wrong for at least half of deals. The reading order should invert by deal thesis.
| Deal thesis | What to read first | Why |
|---|---|---|
| Synergy capture (most strategic acquisitions) | Soft DD (culture, key-person, leadership) | Synergies die without people; $100M of projected cost synergies depends on retaining the top 20% of revenue-tied talent |
| Financial engineering (PE LBOs) | Hard DD (QoE, leverage capacity, working capital) | Leverage capacity gates the deal; soft DD enters at retention-package design post-LOI |
| Talent acqui-hire (most tech M&A under $200M) | Soft DD (leadership, key-person), hard DD as sanity check | If the team doesn't stay, the deal is worthless |
| Market expansion / customer base acquisition | Customer DD (a soft workstream) | NPS, churn cohort, and contract renewability gate the deal |
| IP / R&D pipeline | Legal DD on IP (hard), then leadership DD on the technical team (soft) | IP without the inventors atrophies; the legal chain and the people chain are jointly gating |
| Geographic expansion (cross-border) | Legal/regulatory DD (hard) first, then culture DD (soft) | Cross-border regulatory complexity gates close; culture friction kills integration |
| Distressed acquisition | Hard DD (working capital, contracts, customer renewability) | Survival economics dominate; soft DD comes only after viability is confirmed |
| Roll-up platform add-on | Operational DD (process maturity, systems compatibility) | Integration-cost-per-add-on is the key variable; QoE is secondary at sub-$50M EBITDA |
The most common error I see in PE associate DD plans: they read the alphabet order regardless of why the deal is happening. The DD table of contents should be re-ordered by deal thesis, not by alphabet. This sounds obvious. In practice, deal teams who have built a hard-DD playbook over years of LBOs apply the same playbook to a strategic-synergy deal — and underinvest in the soft DD that would have surfaced the integration-failure prior.
The operational implication for the data room: visitor-group permissioning should follow the reading order. For a synergy-capture deal, the HR and culture clean-team should get earlier read access to the data room than the QoE team. For a financial-engineering LBO, the credit underwriting team and the QoE team get first access, with HR DD coming later. Peony's visitor groups allow workstream-by-workstream permissioning that mirrors the reading order — clean separation prevents cross-workstream contamination of findings and gives the deal team page-level analytics on which workstreams are actually reading what.
Frame 4: Which hard-DD findings should trigger deeper soft DD scope (the Soft DD Trigger Matrix)?
The Trigger Matrix is a rule-set: specific hard-DD findings should automatically trigger specific soft-DD workstreams. The default error is treating hard DD and soft DD as independent — running each workstream against its own checklist without cross-triggering. The Matrix promotes hard-DD findings to leading indicators for which soft-DD workstreams need investment.
| Hard DD finding | Triggers soft DD on |
|---|---|
| Customer concentration >20% on a single customer | Customer DD interviews + key-account-manager retention planning |
| Top-5 customers >50% of revenue | Customer DD primary interviews + customer-loyalty-architecture review |
| Revenue growth concentrated in last 12 months | Leadership DD on sales head + commission/channel-partner DD |
| Working capital wide swings >15% quarter-over-quarter | Operational DD on collections + supplier-relationship DD |
| Founder-CEO with >20% economic interest in the deal | Founder retention plan + culture-after-founder-exit assessment |
| EBITDA add-backs >10% of EBITDA | Operational DD on cost-structure permanence + management quality |
| Pending litigation involving employees | Culture DD + Glassdoor / LinkedIn attrition pattern review |
| Customer churn >10% annually | Customer DD interviews on churn drivers + product-market-fit review |
| Recent leadership turnover at target | Leadership DD on remaining team dynamics + succession planning |
| Material non-compete dependency (per FTC Ban exposure) | HR DD on retention re-engineering post-Ban + comp restructuring |
| IP assignment chain gaps | Leadership DD on technical-team retention + IP-architecture review |
| Cyber-incident history | IT DD + leadership DD on CISO + incident-response posture |
| Founder consulting agreements post-close | Founder transition plan + 90-day cultural assessment |
The pattern that matters: hard-DD findings are usually treated as standalone outputs that flow into the QoE report or the legal memo. The Trigger Matrix promotes them to leading indicators for soft-DD scope expansion — usually before the buyer has time or money to launch the corresponding soft workstream.
The most common operational application: at Week 2 of DD, the QoE team flags customer concentration at 28% on the top customer. The default action is to negotiate purchase-price adjustments for the concentration risk. The Trigger Matrix action is to immediately launch customer DD interviews on that top customer and key-account-manager retention planning — typically a 2-week sprint that costs $30K-$75K. If the customer interviews come back showing loyalty is to the product (not to a specific account manager), the concentration risk drops materially. If the loyalty is to an account manager who has no retention package, the concentration risk is structural, and the deal model needs adjustment beyond price.
The Trigger Matrix is the operational complement to the Cost-of-Skipping Index. The Index sets the budget. The Matrix dispatches the budget.
Frame 5: What does the data room actually do (VDR-Visible) vs what does it not do (Off-Sheet)?
Cleanly partitioning DD work into VDR-visible vs off-sheet is the most useful frame I have for answering the "what does the VDR replace?" question. This partition is honest about what virtual data rooms do and what they don't — and it does not depend on which VDR (Peony, Datasite, Intralinks, iDeals, Firmex, Ansarada) is involved.
VDR-visible work — document-driven, high-leverage tooling:
- Financial DD source documents — audited financials, QoE workpapers, working-capital schedules
- Legal DD — contracts, IP filings, litigation records, regulatory filings
- Tax DD — returns, schedules, audit history
- Commercial DD (partial) — customer lists, pricing schedules, contracts, pipeline reports
- Operational DD (partial) — process documentation, vendor agreements, systems architecture diagrams
All of this lives in the data room and benefits from VDR-native features: permissioning, audit trails, structured Q&A workflow, AI-assisted indexing, version control, and engagement analytics. These workstreams are 3-5x faster and tighter inside a modern VDR than over email-and-Sharepoint.
Off-sheet work — interview-driven, requires human work outside the VDR:
- Cultural DD via OCAI and Denison surveys plus employee and leadership interviews
- HR DD on key-person dependency — 1:1 conversations and reference calls
- Customer DD via primary interviews — typically clean-team coordinated under NDA
- Leadership DD — psychometric assessment (Hogan, Korn Ferry KF4D) plus behavioral interview
- Brand DD — sentiment research, brand-architecture decision, customer perception studies
- Site visits and operational walkthroughs — physical or virtual, but not document-driven
This work happens through clean teams, executive interviews, and customer reference calls — outside the data room by structural necessity. The seller will not grant pre-close access to its employees or customers for survey-based or interview-based DD. Buyers work around the access constraint with outside-in cultural assessment (Glassdoor, LinkedIn attrition signals, customer review sites, regulatory filings) plus limited clean-team interviews under tightly scoped NDA.
The honest VDR position:
- The data room makes hard DD 3-5x faster and tighter — that is its primary value.
- The data room holds the artifacts that come out of soft-DD work — org charts, OCAI reports, leadership-assessment summaries, retention-plan drafts, customer-interview write-ups — so deal teams can reference soft-DD findings alongside hard-DD evidence.
- The data room does not perform the off-sheet workstreams. No VDR replaces Spencer Stuart, Heidrick, Korn Ferry, ghSMART, Hogan, Mercer, McKinsey Org Practice, Bain People & Org, or the specialty customer-research firms.
This is universal across modern VDRs — not Peony-specific. The honest position to take in M&A copy: the modern DD stack is VDR + culture/leadership consultancy + customer-research firm + financial QoE provider + legal counsel. All five workstreams' artifacts live in the data room. Only one is the data room. Vendor stacking is the answer; platform consolidation is not.
Honest comparison: which tools fit each DD lens?
| DD workstream | Lens | Tool category | Named vendors (2026) | Where Peony fits |
|---|---|---|---|---|
| Financial DD source docs | Hard | VDR | Peony, Datasite, Intralinks, iDeals, Firmex, Ansarada | Direct competitor; sub-$500M EV deal sweet spot |
| QoE engagement | Hard | QoE consultancy | EY-Parthenon, Alvarez & Marsal, BDO, Deloitte, RSM, CBIZ MHM | Peony stores QoE workpapers + audit trail |
| Legal DD | Hard | Law firm | Kirkland, Latham, Skadden, Cooley, Wachtell, Sullivan & Cromwell | Peony stores contracts + IP filings + Q&A audit trail |
| Tax DD | Hard | Big 4 / tax specialist | EY, PwC, KPMG, Deloitte, BDO, Andersen | Peony stores returns + schedules |
| Commercial DD | Hard + Soft | Strategy consultancy | Bain, L.E.K., OC&C, McKinsey, EY-Parthenon | Peony stores commercial DD reports + customer lists |
| HR / Talent DD | Soft | HR / leadership consultancy | Mercer, Aon, WTW, Korn Ferry, AIHR | Peony stores org charts + retention-plan drafts |
| Culture DD | Soft | Culture consultancy | McKinsey Org Practice, Bain People & Org, Spencer Stuart, ghSMART, OCAI deployment partners | Peony stores OCAI/Denison reports + clean-team write-ups |
| Customer DD | Soft | Customer research firm | Vantage, Strategex, Deep-Insight, PwC Customer Practice | Peony stores NPS reports + customer-interview transcripts |
| Brand DD | Soft | Brand-valuation specialist | Brand Finance, Interbrand, Kantar BAV, MBLM | Peony stores brand-architecture decision + valuation report |
| Leadership DD | Soft | Executive assessment | Heidrick, Spencer Stuart, Korn Ferry, ghSMART, Hogan, Mercer | Peony stores assessment summaries + behavioral-interview write-ups |
The pattern: Peony is the substrate that holds the artifacts, regardless of which specialist firm performs each workstream. Peony does not replace any specialist firm. The competitor decision Peony actually contests is the VDR choice — Peony vs Datasite vs Intralinks vs iDeals vs Firmex vs Ansarada — which is a hard-DD-tooling decision.
The honest VDR limits where I would recommend a buyer or seller choose a different platform:
- Above $500M EV — for deals where regulatory complexity and workstream count are very high, Datasite or Intralinks typically have more institutional integrations with QoE providers, law firms, and R&W underwriters built in. The premium is meaningful (often 5-10x Peony pricing) but the workstream-orchestration value can justify it.
- Large bank-led $1B+ M&A — banks have established VDR preferences and integrated workflows. New VDR introduction creates friction.
- For pure soft-DD substrate (HR DD, culture DD, leadership DD only, no hard DD) — Peony works but is over-engineered. A simple Box/Sharepoint folder + a culture-DD consultant can suffice if no hard-DD scope exists.
- Where Peony fits best — sub-$500M EV M&A, founder-led sales, PE recapitalizations, strategic mid-market acquisitions, and any deal where both hard and soft DD artifacts need to live in the same room with workstream-by-workstream visitor permissioning.
How does soft DD feed SPA reps + retention escrow?
Soft DD findings flow into the Stock Purchase Agreement through three primary mechanisms. The mechanics matter because under-documented soft-DD findings can either get excluded from R&W coverage or surface as post-close indemnification disputes.
Mechanism 1: Reps and warranties. Cultural-DD findings on undisclosed labor disputes, harassment patterns, or systemic compliance issues get captured in standard employee/labor reps and disclosure schedules. HR-DD findings on misclassified contractors, unfunded benefit obligations, or pension underfunding get captured in benefit reps. Leadership-DD findings on undisclosed executive conflicts, founder-conflict disputes, or non-compete invalidation exposure get captured in management reps or specific founder-conduct reps. The SRS Acquiom 2026 data shows seller rep-survival on RWI deals at the lowest in 4 years — 43% — signaling more reliance on R&W insurance and less direct seller indemnity. Soft-DD findings well-documented in the data room support the disclosure schedule and the reps; under-documented findings increase the seller's exposure to post-close claims.
Mechanism 2: Retention escrow. WTW's 2024 M&A Retention Study shows 72% of acquirers now structure retention payments. The standard mechanics: payments tied to continued employment milestones (12-month, 18-month, 24-month vests), held in escrow at the closing trust agent, released on milestone achievement. Median payment: 75-100% of base salary for C-suite, 50% for other senior leaders, 30% for rank-and-file. The escrow size on a $50M-$500M deal typically runs $1M-$10M total across the named retention pool. Retention-escrow structure is one of the cleanest ways to convert a soft-DD finding (key-person flight risk) into a hard contractual mechanism. The retention agreements themselves live in the data room with limited access.
Mechanism 3: Indemnification baskets. Known soft-DD findings — flagged key-person flight risk, customer concentration on retention-dependent accounts, founder consulting overlap — typically flow into specific indemnification carve-outs. The standard mechanics: a "general basket" caps indemnification for unknown breaches (typically $250K-$1M threshold); "special baskets" carve out higher caps and longer survival periods for known risks. A flagged key-account customer-concentration finding might be captured in a special indemnification basket with a 24-month survival period and a $5M cap, separate from the general basket's $500K-1.5M cap. The basket structure depends on RWI coverage scope — under-diligenced areas excluded from RWI coverage typically need larger special baskets.
The R&W insurance interaction is the structural piece many deal teams miss. R&W coverage scope depends directly on DD rigor — insurers limit or exclude coverage on areas not professionally scrutinized. Under-diligenced soft-DD areas (cultural DD never run, leadership DD limited to CEO only, customer DD never done) get excluded from R&W coverage, shifting the post-close risk back to the buyer's balance sheet. The 65% expected R&W use increase in 2025 per CBIZ amplifies this dynamic: as more deals rely on R&W as the primary indemnification mechanism, the DD rigor expected by underwriters is rising in parallel.
For deals where soft DD is structurally hard (cross-border, regulated industry, founder-controlled targets), the strongest post-close evidence chain combines: (1) retention escrow tied to specific named individuals, (2) carved-out indemnification baskets for flagged risks, (3) clean-team interview write-ups stored in the data room with restricted access, and (4) explicit soft-DD methodology citations (OCAI deployment, Hogan assessment, Vantage NPS) in the disclosure schedule. Peony's audit trail and granular permissioning allow post-close disclosure-chain reconstruction — useful when soft-DD findings surface as indemnification claims 12-24 months after close.
Bottom line
Hard DD is the documents and the math. Soft DD is the people and the patterns. The 2024-2026 data is clear: 50-75% of M&A deals fail to hit integration targets on cultural clashes, ~60% of PE portfolio-company CEOs are replaced within Year 1, and only 10-20% of acquirers apply the same rigor to cultural DD as to financial DD. The gap between what kills deals and what gets diligenced is the largest single source of post-close value destruction.
The five frames I use to operationalize this: Cost-of-Skipping Index to set the soft-DD budget at the LOI; Integration Failure Triple to pattern-match the deal against canonical failure modes; Hard-to-Soft Reading Order to re-sequence the DD table of contents by deal thesis; Soft DD Trigger Matrix to dispatch the soft-DD budget against specific hard-DD findings; and VDR-Visible vs Off-Sheet to honestly partition what the data room does and does not do.
The VDR plays one structural role: the substrate that holds artifacts from all five hard-DD pillars and from the five soft-DD workstreams. It does not replace Spencer Stuart, Heidrick, Korn Ferry, ghSMART, Hogan, McKinsey Org Practice, Bain People & Org, Vantage, Strategex, Brand Finance, or any of the specialist firms whose work the data room ends up holding. Peony fits sub-$500M EV M&A and founder-led sales where both hard and soft DD artifacts need workstream-by-workstream visitor permissioning. Above $500M EV, Datasite and Intralinks usually win on institutional integrations.
The one decision I would push every deal team to make: at LOI signing, lock the soft-DD budget at a minimum of 10-15% of total DD spend, with named workstream allocations against the Cost-of-Skipping Index. The cost is small ($200K-$500K on a $50M-$500M deal). The downside protection — against the 50-75% cultural-failure base rate — is large. Most deals don't fail because the QoE was wrong. They fail because the people were wrong.
Related resources
- M&A Due Diligence: 6-Phase Playbook + 8 Workstreams — the canonical process guide that covers hard DD workstreams in depth
- HR Due Diligence: The 3-Lens Framework — the deep-dive on the soft-DD workstream Peony has covered most thoroughly, including Talent/Liability/Culture lens scoring
- Operational Due Diligence: The 8-System Audit — bridges hard-DD and soft-DD workstreams via process maturity
- Commercial Due Diligence: 4-Quadrant Buyer Posture Map — covers the commercial DD workstream that straddles hard and soft
- Sell-Side Due Diligence: The 90-Day Prep Pyramid — sell-side vendor DD scope, including pre-marketing soft-DD remediation
- Due Diligence Questionnaire: The 220-Item DDQ Template — the canonical questionnaire structure that maps to both hard and soft scope
- Due Diligence Red Flags Library — the red-flag library that feeds the Soft DD Trigger Matrix
- M&A Data Room: Setup and Workstream Mapping — the data room setup playbook that mirrors the hard/soft partition
- State of M&A Data Rooms: 2026 Benchmark — the 283-deal Peony platform benchmark that anchors workstream timing
Footnotes and sources
- Harding, D. & Rouse, T. (April 2007). "Human Due Diligence." Harvard Business Review, pp. 124-131 (R0704J). https://hbr.org/2007/04/human-due-diligence
- McKinsey & Company. "Why managing culture is critical for value creation in M&A." https://www.mckinsey.com/capabilities/m-and-a/our-insights/why-managing-culture-is-critical-for-value-creation-in-m-and-a
- KPMG. "2026 M&A Deal Market Study." https://kpmg.com/us/en/articles/2026/kpmg-2026-m-a-outlook.html
- KPMG. "Integration Gap Report" (April 2026). https://kpmg.com/us/en/media/news/total-experience-report.html
- PwC. "2023 M&A Integration Survey." https://www.pwc.com/us/en/services/consulting/deals/library/ma-integration-survey.html
- WTW. "2024 M&A Retention Study." https://www.wtwco.com/en-us/insights/2024/03/2024-m-and-a-retention-study
- Bain & Company. "Cultural Integration in M&A Report 2023." https://www.bain.com/insights/cultural-integration-m-and-a-report-2023/
- Bain & Company. "Looking Back at M&A in 2025: Behind the Great Rebound" (2026). https://www.bain.com/insights/looking-back-m-and-a-report-2026/
- SRS Acquiom. "M&A Trends: 2026 Deal Terms Study." https://www.srsacquiom.com/our-insights/deal-terms-study/
- SRS Acquiom. "M&A Working Capital Purchase Price Adjustment Study 2026." https://www.srsacquiom.com/our-insights/working-capital-adjustment-study/
- CBIZ. "Representations and Warranties Insurance in 2025 M&A." https://www.cbiz.com/insights/article/representations-and-warranties-insurance-in-2025-ma-trends-and-best-practices
- HSF Kramer. "M&A Due Diligence: Deeper Dives" (2025 Global M&A Report). https://www.hsfkramer.com/insights/reports/2025/global-ma-report-2025/due-diligence-deeper-dives
- Hunt Scanlon Media. "How to Identify Leadership Potential in Private Equity Acquisitions." https://huntscanlon.com/how-to-identify-leadership-potential-in-private-equity-acquisitions/
- Hogan Assessments. "How to Identify Leadership Potential in Private Equity Acquisitions." https://www.hoganassessments.com/blog/how-to-identify-leadership-potential-in-private-equity-acquisitions/
- MIT Sloan Management Review. "Why Mergers Fail." https://sloanreview.mit.edu/article/why-mergers-fail-and-how-to-spot-trouble-early/
- CFO.com. "28% of Companies Involved in M&A Lack Key-People Retention Plans" (2024). https://www.cfo.com/news/28-of-companies-involved-in-ma-lack-key-people-retention-plans/714408/
- Walgreens / VillageMD $5.8B Q2 2024 impairment. https://www.fiercehealthcare.com/retail/walgreens-takes-6b-hit-q2-villagemd-investment
- Sony / Bungie $765M 2026 write-down. https://www.pushsquare.com/news/2026/05/is-bungie-sonys-worst-ever-acquisition-after-usd765-million-write-down
- OCAI (Organizational Culture Assessment Instrument). https://www.ocai-online.com/about-the-Organizational-Culture-Assessment-Instrument-OCAI
- Denison Organizational Culture Survey (DOCS). https://denisonconsulting.com/wp-content/uploads/2019/05/denison-culture-survey-d48.pdf
- Brand Finance. "M&A Due Diligence." https://brandfinance.com/services/due-diligence
- DuedilIO. "Quality of Earnings Analysis Guide 2025." https://www.duedilio.com/quality-of-earnings-analysis-guide-2025/
- Mercer. "Leadership Assessment in M&A." https://www.mercer.com/en-us/solutions/talent-and-rewards/talent-assessment/leadership-assessment-in-m-and-a/
- PMI Stack. "Post-Merger Integration Statistics 2024-2026." https://pmistack.com/blog/post-merger-integration-statistics
- E2E Deal Insights. "The Top 10 Talent Retention Challenges After M&A." https://e2edealinsights.com/2025/10/30/the-top-10-biggest-talent-retention-challenges-after-ma/
You might also like
May 27, 2026
What Is Due Diligence? A 2026 Hub Guide to All 7 Types
May 16, 2026
12 Due Diligence Mistakes That Kill M&A Deals (2026): Working Capital Wedge + Bain Test
May 16, 2026
38 Due Diligence Red Flags Across 6 Streams (2026): Severity Matrix + Walk Rate