
Independent Sponsor Financial Model: 2026 Template + Walkthrough

Co-founder at Peony. Former M&A at Nomura, early-stage VC at Backed VC, and growth-equity / secondaries investor at Target Global. I write about investors, fundraising, and deal advisors from the deal-side perspective I spent years in.
Last updated: April 2026
Quick answer: An IS financial model passes capital-partner diligence when it carries 7 lean tabs (cover + assumptions, sources and uses, integrated 3-statement, debt schedule, formula-driven waterfall, sensitivity tables, one-page memo) — built in the order the IC reads them, not the order Excel lays them out. The five Excel mistakes that kill models are mechanical and fixable: hardcoded promote tiers, broken three-statement integration, missing cash sweep logic, PIK interest not compounding into balance, and management rollover double-counted on the S&U table. Fix those five before week 1 of capital-partner review and you compress diligence by 7 to 14 days on a $30M EV / $5M EBITDA deal.
The single hardest question this post answers: what does the financial model need to look like to pass capital-partner diligence on the first read? Three IS personas pull this guide most often. First, the first-time IS founder building the model from scratch under a 90-day exclusivity clock — needs the 7-tab architecture and the build order before week 1. Second, the CFO joining a portfolio company at close who is sanity-checking the sponsor's projections — needs to know which formula links must be intact and which assumptions need source documentation. Third, the capital-partner principal reviewing the model on a Monday IC — needs to triage which of the five Excel mistakes is the kill signal versus a fixable comment. Everything below is built so each of the three opens the post, reads the relevant section, and gets a decision in under 20 minutes.
I spent years at Backed VC and Target Global reviewing LMM PE and IS deal models before starting Peony, a data room platform. Over the past year I have watched hundreds of independent sponsor financial models flow through our platform en route to capital partners — and the gap between models that close capital and models that get a polite pass in week 1 is structural, not stylistic. The five most common Excel mistakes that get an IS model rejected by capital partners (Multiple Expansion, UpLevered, Edward Bodmer) are all mechanical — hardcoded waterfalls, broken three-statement integration, missing cash sweep logic, PIK interest mismodeled, and rollover equity double-counted. Fix those five before you ship the model and you compress your post-LOI capital partner diligence by 7 to 14 days.
This post is the 2026 IS financial model playbook — the 7-tab architecture every IS model needs, a worked $30M EV / $5M EBITDA capital stack with full sources and uses reconciliation, formula-driven waterfall mechanics, the sensitivity tables capital partners actually demand, and the five Excel mistakes that get models rejected. It sits alongside three tactical siblings in our IS cluster: the deal book guide covers the 10 sections of the capital partner pitch document (the model is Section 6 of that book); the capital raising playbook covers Stage 3 (deal economics) and Stage 4 (capital stack design) at the LP-relationship level; and the SBIC for IS playbook covers the 8-stage SBIC sub-debt access path. This post is distinct from all three — it is the deep dive on the mechanics of building the model file itself, not the broader process of running an IS deal. For vertical-specific capital partner directories see our verticals: healthcare, business services, manufacturing, tech/software, consumer, distribution/logistics, and cleantech/energy.
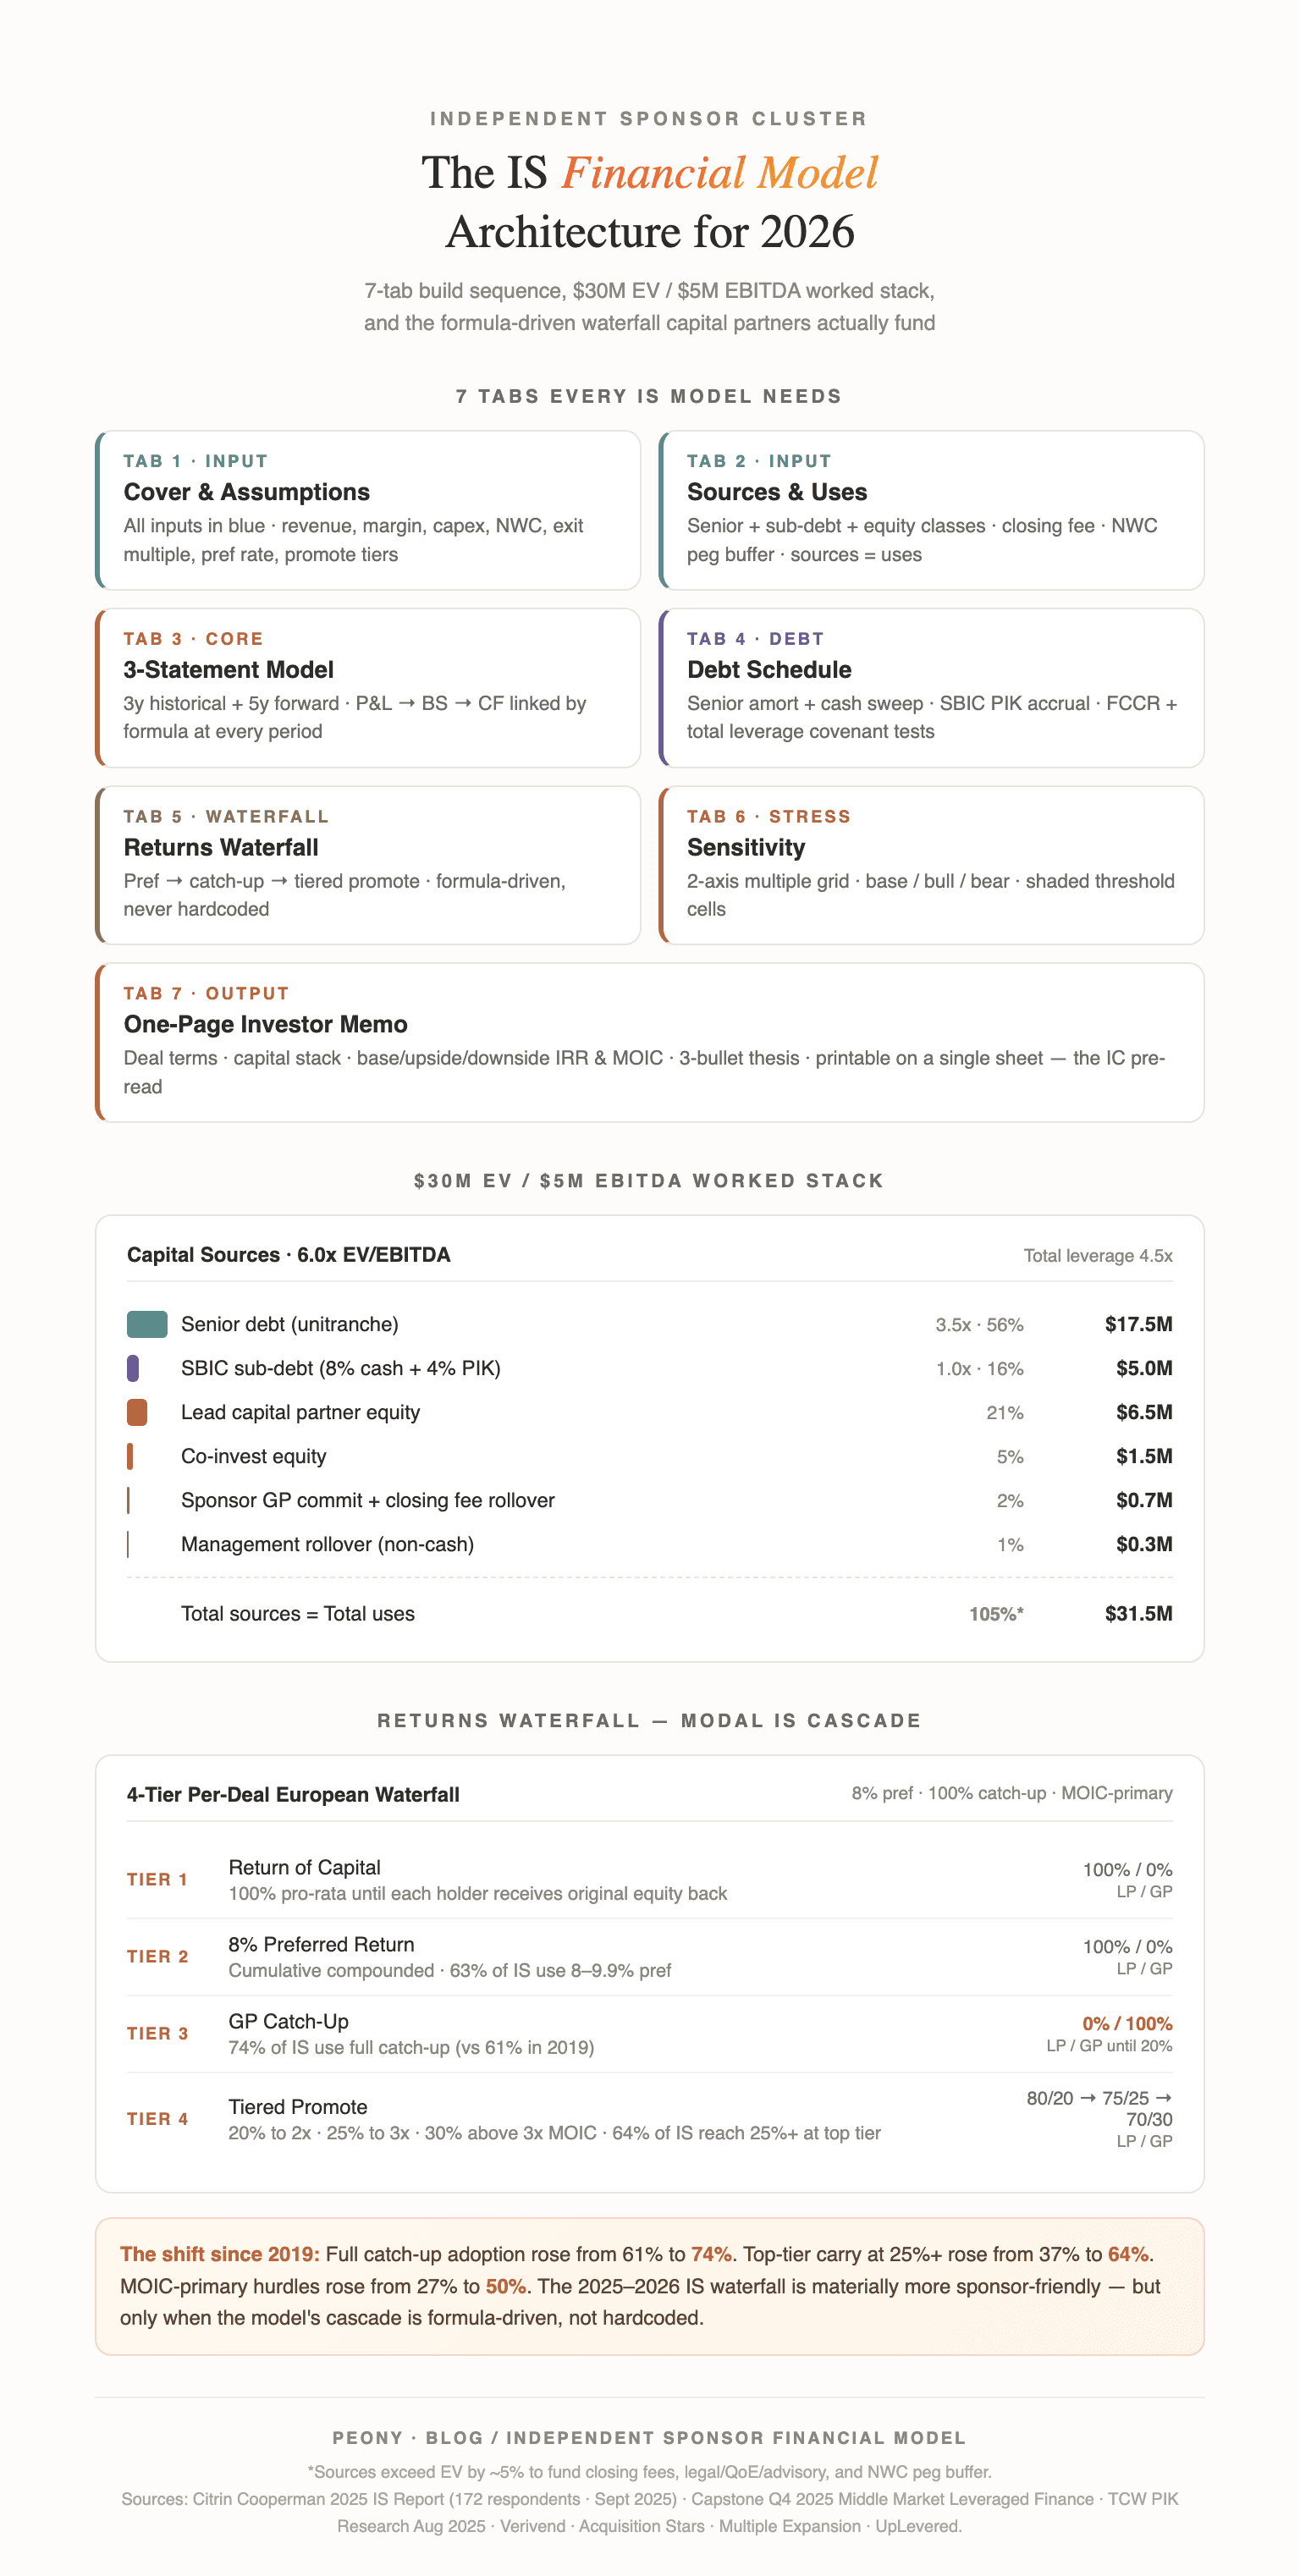
TL;DR: 86% of independent sponsors plan to close 1 to 2 platform deals over the next 18 months per the Citrin Cooperman 2025 IS Report (172 respondents — 151 sponsors plus 21 capital providers, released September 2025), and the financial model is the single deliverable that determines whether each of those deals closes. 74% of IS now use a full catch-up in the waterfall (up from 61% in 2019), 64% achieve 25%+ carry at the highest hurdle (up from 37% in 2019), 50% use MOIC as the primary hurdle (up from 27% in 2019), and 56% charge a 2% closing fee on EV — the de facto standard that should be a discrete line in your sources and uses table, not a buried assumption. The 2026 IS model architecture: 7 tabs lean (cover & assumptions / sources & uses / 3-statement integrated / debt schedule / waterfall / sensitivity / one-page memo) or 10 tabs diligence-ready (add working capital schedule / tax & QSBS / comparable transactions). The $30M EV / $5M EBITDA worked stack: **3.5x senior unitranche at SOFR + 525 bps (~10% all-in), 1.0x SBIC sub-debt at 8% cash + 4% PIK = 12% all-in, 30% equity ($9M) split across lead capital partner / co-invest / GP commit / management rollover, total leverage 4.5x — at market for LMM 2025 per Capstone Q4 2025 Middle Market Leveraged Finance. Five Excel mistakes that kill models: hardcoded promote tiers, circular reference handling unflagged, missing cash sweep logic, PIK interest not compounding into balance, and management rollover double-counted in S&U — all citeable to Multiple Expansion, UpLevered, and Wall Street Oasis. Capital partner base case IRR floor: 30%+ under base case per CapitalPad; **68% of completed IS exits returned 3x MOIC or more, 30%+ returned 5x or greater** per Citrin Cooperman 2025 via Smash.vc. Peony Data Room at $52/admin/month runs the IS model workflow — NDA-gated rooms with AI auto-indexing, dynamic watermarks per capital partner, page-level analytics, AI Smart Q and A, and e-signatures inside the room — at a fraction of the $25K+ legacy VDR enterprise pricing structure.
The 8-Section Financial Model Playbook
Every IS financial model that closes capital runs the same eight sections. The skill is building them in the order capital partners read the model, not the order Excel naturally lays them out. Most first-time IS sponsors ship the operating model first and the waterfall last — the opposite of how a capital partner IC reviews the file. Here is the framework with anchor links to each section.
| Section | What It Covers | Link |
|---|---|---|
| 1 | Why the IS model differs structurally from a PE LBO model | Jump |
| 2 | The 7 tabs every IS financial model needs | Jump |
| 3 | The $30M EV / $5M EBITDA worked sources and uses | Jump |
| 4 | Modeling the IS capital stack and debt schedule | Jump |
| 5 | The IS equity waterfall — pref, catch-up, tiered promote | Jump |
| 6 | The sensitivity analysis capital partners demand | Jump |
| 7 | The five Excel mistakes that get models rejected | Jump |
| 8 | What three IS model patterns do capital partners see most often | Jump |
Why Is the IS Financial Model Structurally Different from a PE LBO Model?
The IS financial model differs structurally from a committed-fund PE LBO model in five ways, and getting any of them wrong signals to a capital partner that the sponsor has imported the wrong template. The capital stack is layered deeper, the waterfall is per-deal European rather than whole-fund, sponsor economics include fees in addition to promote, the rollover equity treatment varies, and the hurdle has shifted from IRR-only to MOIC-primary. Each difference compounds in the model.
Capital stack layering. A committed-fund PE LBO model typically handles three layers — senior debt, sponsor equity, and occasionally a strip of mezzanine. An IS model handles five or six: senior debt + SBIC subordinated debt or non-SBIC mezzanine + lead capital partner equity + co-invest equity + sponsor GP commit + management rollover. Each equity slice has its own preferred return, its own waterfall ordering, and its own tag-along and drag-along language that affects exit modeling. The Citrin Cooperman 2025 IS Report found 62% of IS rely on family offices as the primary equity capital source and 85% of sponsors use family offices in some capacity per the Axial 2025 IS Report — which means most IS models have at least three distinct equity classes (lead family office + co-invest from a second family office or HNWI + sponsor GP commit) before management rollover even enters the picture.
Per-deal European waterfall. Committed-fund LBO models typically use whole-fund waterfalls — net winners against losers across portfolio companies, GP gets carry only after the entire fund returns 1.0x MOIC plus pref. IS waterfalls are per-deal European — your promote is computed on a single deal's cash flows, you cannot net across portfolio companies, and your carry is realized at the exit of each individual platform. The model implication is that every deal's waterfall stands alone, so the formula cascade has to be built specifically for each model — copy-pasting from a committed-fund template breaks because the whole-fund crystallization logic does not apply.
Sponsor economics include fees. Committed-fund LBO models capture sponsor economics through the management fee on committed capital and the promote at exit — there is no closing fee, and the management fee is a fund-level construct paid by all LPs. IS models include three discrete sponsor economic items: a closing fee at acquisition (56% of IS charge 2% of EV, with 28% receiving more than $500K per Citrin Cooperman 2025), an annual management fee (51% use a percentage of EBITDA structure with a floor and cap, 69% use 5% of EBITDA, and 54% receive $251K-$500K annually), and the promote with full catch-up (74% of IS) and tiered hurdles. Each fee is paid by the portfolio company at the cost of equity returns, which affects the waterfall math because fees flow through cash flows to operations before debt service and equity distributions.
Rollover equity treatment. Committed-fund LBO models typically handle rollover as a single line — rolled equity becomes part of management's stake post-close. IS models have to handle rollover with explicit treatment because 56% of IS roll their closing fee into equity and 42% roll the closing fee fully into equity per Verivend's capital stack analysis, meaning the sponsor's effective equity stake at close is meaningfully larger than the cash GP commit suggests. The S&U table needs separate lines for cash sponsor commit and rollover-of-fees-into-equity to avoid the double-counting trap that overstates the equity raise.
Hurdle metric shift to MOIC-primary. 50% of IS deals now use MOIC as the primary hurdle (up from 27% in 2019), with 22% using a hybrid MOIC plus IRR (up from 16% in 2019) per Citrin Cooperman 2025. Committed-fund LBO models built around IRR hurdles need restructuring when the hurdle shifts to MOIC — IRR rewards short holds even when cash multiples are mediocre, while MOIC rewards absolute cash returns regardless of timing. The waterfall formula cascade differs structurally because the MOIC trigger evaluates cumulative distributions divided by cumulative contributions, while the IRR trigger evaluates a discount rate on the cash flow series.
The strategic question for any IS in 2026 is not whether to import a PE LBO template but how to extend it with the IS-specific layers that matter. The best practice is to build the integrated 3-statement core from a Wall Street Prep or Street of Walls template, then add discrete tabs for the IS-specific elements — closing fee and management fee schedule, multi-class equity waterfall with full catch-up, SBIC tranche debt schedule with PIK accrual and cash sweep, and management rollover treatment in the S&U. Capital partners read these IS-specific elements first because they are the structural differentiators of an IS deal versus a generic LBO.
What Are the 7 Tabs Every IS Financial Model Needs?
The lean IS financial model architecture is 7 tabs. The diligence-ready version is 10 tabs with three additional appendices. Sponsors who ship more than 10 tabs typically have an over-engineered model that capital partners flag as a sign of inexperience — the discipline is in keeping the architecture tight. Synthesis from Wall Street Prep, Street of Walls, and A Simple Model confirms this is the modal architecture top IS firms ship.
Tab 1 — Cover and Assumptions
The cover page is the first tab a capital partner opens. It carries the deal name, target company name, sponsor name, transaction date, EV, EBITDA, EV/EBITDA multiple, hold period, and the contact information for the sponsor and capital partner counterparties. The assumptions section sits underneath the cover — every input cell that drives the model lives here, formatted in a single color (blue is industry standard for hardcoded inputs) so the reader can immediately see what to flex. Inputs include revenue growth by year, EBITDA margin trajectory, capex as a percentage of revenue, working capital as days outstanding, exit multiple at year 5, senior debt sizing and pricing, sub-debt sizing and pricing, the pref rate, the catch-up structure, the promote tiers, and the hold period. Best practice is to keep this tab to one printable page so capital partners can see all the assumptions in one view.
Tab 2 — Sources and Uses
The S&U table reconciles where the deal money comes from (sources) and where it goes (uses). Sources include senior debt, SBIC sub-debt or non-SBIC mezzanine, lead capital partner equity, co-invest equity, sponsor GP commit (cash plus rollover-of-closing-fee), and management rollover. Uses include the purchase price (EV times EBITDA multiple), the closing fee paid to the sponsor (2% of EV per Citrin Cooperman 2025), legal and diligence fees (typically 2% of EV blended across legal, QoE, advisory), and a working capital adjustment buffer (typically $200K-$500K depending on peg variance). Sources must equal uses or your reader stops reading.
Tab 3 — Operating Model (Three-Statement Integrated)
The operating model is the largest tab and the heart of the model. It runs 3 years historical, current year projection, and 5 years forward — total 8 to 9 years of annual data plus quarterly or monthly granularity for the first 12 to 24 months post-close. The income statement, balance sheet, and cash flow statement must be linked by formula and tie at every period — if the cash flow statement does not reconcile to the change in cash on the balance sheet, your model is broken and capital partners stop reading. Per Axial 2025 IS Report, QoE EBITDA discrepancies were the second largest reason LOIs broke at 21.3% — and unintegrated models compound that risk by signaling sloppy process.
Tab 4 — Debt Schedule
The debt schedule shows every debt instrument's principal balance, interest expense (cash and PIK separately), mandatory amortization, optional cash sweep, and ending balance period by period. Senior debt typically amortizes 1% per year mandatory plus an excess-cash-flow-based sweep that flushes 50% to 75% of free cash flow to senior principal until total leverage drops below a covenant threshold. Sub-debt typically has a 5- to 7-year bullet maturity with PIK that compounds into principal — meaning the ending balance grows over time even though the company is current on cash interest. The debt schedule also computes the fixed charge coverage ratio (FCCR) and total leverage covenant tests period by period, with a separate row showing covenant cushion (the dollar amount by which the company is currently above or below the covenant threshold).
Tab 5 — Returns Waterfall
The waterfall computes the equity distribution at exit across all classes — lead capital partner, co-invest, sponsor GP commit, management rollover, and any SBIC warrants exercised. The cascade runs in sequential tiers: return of capital (100% to LPs and sponsor pro-rata until each class receives original equity back), preferred return (8% cumulative compounded annual pref to LPs), catch-up (100% to GP until GP receives 20% of total profits to date — used by 74% of IS per Citrin Cooperman 2025), and tiered promote (typically 20% to GP up to 2x MOIC, 25% from 2x to 3x, 30% above 3x — representative tiers per Acquisition Stars). The waterfall must be formula-driven so capital partners can flex any tier in real time during diligence — hardcoded waterfalls are the most common reason a model gets sent back for rebuild.
Tab 6 — Sensitivity Tables
Sensitivity runs at minimum a 2-axis table showing IRR or MOIC across entry multiple (column) and exit multiple (row), with a third dimension on hold period. The base case sits in the center of the table, with bull cases above and bear cases below. Capital partners look at three specific cells first: the base case (does it pencil at 25%+ IRR / 3x MOIC), the down case (does the IRR stay above the 8% pref threshold under EBITDA -20% / multiple -1.5x / hold +2 years), and the cell where MOIC crosses 1.0x (where do the equity holders take losses). Shade those cells visually so the reader can find them in 30 seconds. Multiple Expansion's sensitivity guidance and Financial Edge sensitivity analysis training both confirm the 2-axis multiple-multiple table with shaded threshold cells is the modal capital-partner-grade sensitivity layout.
Tab 7 — Investor Memo (One Page)
The investor memo is the one-page summary capital partners screenshot for their IC pre-read. It carries the deal terms (EV, EBITDA, multiple, hold), the capital stack (senior + sub-debt + equity by class), the returns summary (base / upside / downside IRR and MOIC), the sponsor's value creation thesis in three bullets, and the exit pathway. The page must be printable on a single 8.5x11 sheet — capital partners flag multi-page memos as a sign the sponsor cannot summarize the deal. This is the tab the IC reads first when deciding whether to greenlight diligence.
Diligence-Ready Add-ons (Tabs 8-10)
For Stage 2 release post-soft-quote, add three appendix tabs. Tab 8 — Working Capital Schedule with the closing peg calculation, the variance band, and the dollar-for-dollar adjustment mechanism per Capstone's NWC analysis. Tab 9 — Tax and QSBS Analysis modeling the qualified small business stock exclusion if the deal qualifies — the McGuireWoods 2025 IS Conference takeaways noted the QSBS update at $75M asset threshold with a $15M or 10x basis exclusion cap and tiered exclusions of 50% / 75% / 100% at 3 / 4 / 5 years held per the McGuireWoods 2025 conference summary. Tab 10 — Comparable Transactions showing 4-6x EBITDA bucket and 6-8x EBITDA bucket recent transactions from the Citrin Cooperman 2025 valuation multiples data — 54% of IS deals closed at 4-6x and 37% at 6-8x in 2025.
The IS community does not have an open-source authoritative Excel template — A Simple Model and Wall Street Prep are the two most-modified starting points; CapitalPad and Verivend publish the most useful capital-stack walkthroughs; the Searchfunder community actively discusses template-sharing. Build from a clean LBO template, extend with the IS-specific tabs above, and template the architecture so deal 2 onward compresses your build time from 3 weeks to 5 to 7 days.
How Do You Build the Sources and Uses on a $30M EV / $5M EBITDA Worked Example?
A worked example shows the S&U mechanics in concrete terms. Take a $5M EBITDA business services platform priced at 6.0x EV/EBITDA = $30M total enterprise value. Here is the sources and uses table with every line item showing the calculation logic and the source for the assumption.
| Line | Amount | % of EV | Sizing logic / source |
|---|---|---|---|
| SOURCES | |||
| Senior debt (unitranche) | $17.5M | 58.3% | 3.5x EBITDA per Capstone Q4 2025; SOFR + 525 bps ≈ 10% all-in |
| SBIC subordinated debt | $5.0M | 16.7% | 1.0x EBITDA per Verivend; 8% cash + 4% PIK = 12% all-in |
| Lead capital partner equity | $6.5M | 21.7% | Family office or HNWI lead per Axial 2025 (85% of sponsors use family offices) |
| Co-invest equity | $1.5M | 5.0% | Second family office or HNWI co-invest |
| Sponsor GP commit (cash) | $0.3M | 1.0% | 3% of equity per Acquisition Stars (range 1-5%) |
| Sponsor closing fee rollover | $0.4M | 1.3% | 56% of IS roll closing fees per Verivend; 70% rollover assumed |
| Management rollover equity | $0.3M | 1.0% | CEO/CFO personal rollover (non-cash source) |
| Total Sources | $31.5M | 105.0% | Reconciles to total uses |
| USES | |||
| Purchase price (6.0x × $5.0M) | $30.0M | 100.0% | At market for LMM 2025 per Citrin Cooperman 2025 (54% close at 4-6x, 37% at 6-8x) |
| Sponsor closing fee (2% EV) | $0.6M | 2.0% | Citrin Cooperman 2025 (56% of IS use 2% on EV) |
| Legal + Q of E + advisory | $0.6M | 2.0% | LMM blended fees ($30K-$75K Q of E + $200K-$300K legal + $100K-$200K advisory) |
| Working capital adjustment | $0.3M | 1.0% | Buffer for NWC peg variance per Capstone Partners NWC |
| Total Uses | $31.5M | 105.0% | Reconciles to total sources |
Three structural mechanics worth understanding from this S&U. First, the rollover of the sponsor's closing fee into equity is the single most-misunderstood line on the IS S&U. Per Verivend's analysis, 56% of IS roll their closing fees and 42% roll fully — meaning the sponsor's effective equity stake is the cash GP commit ($0.3M) plus the rolled closing fee ($0.4M, ~67% of $0.6M) = $0.7M, not the $0.3M cash figure. This matters because the lead capital partner reads the GP commit line as alignment signal — and a $700K effective sponsor commit on a $30M EV deal signals materially more skin-in-the-game than $300K. Always show both lines explicitly.
Second, the management rollover is a non-cash source — the CEO and CFO retain a portion of their existing equity stake rather than cashing out, which means the sponsor and lead capital partner do not need to raise the rollover dollar amount in fresh equity. Sponsors who treat rollover as additional cash equity inflate the equity raise and understate the true sponsor commit percentage. Show rollover as a discrete line with a footnote clarifying it is non-cash.
Third, the 2% closing fee plus 2% legal/QoE/advisory plus 1% NWC buffer = 5% of EV in transaction costs is the modal LMM fee load. On a $30M EV deal that is $1.5M of fees and adjustments — material to model accurately because they reduce the effective EV that drives the senior debt sizing covenant test. A senior lender pricing 3.5x leverage on EBITDA but holding the test on funded debt at acquisition will look at the gross capital deployed ($31.5M including fees), not the net purchase price ($30M).
The S&U for a $30M EV deal needs to balance precisely — sources must equal uses to the dollar, and any discrepancy signals to the capital partner that the sponsor has not run the diligence math. Build the S&U in Tab 2 of your model with formula-driven calcs that pull from the assumptions tab, so when you flex the entry multiple from 6.0x to 6.5x, every line item recalculates in real time. See our data room checklist for the full 42-document organization including where the S&U lives in the data room.

How Do You Model the IS Capital Stack and Debt Schedule?
The debt schedule is Tab 4 of the model and the place where capital partners verify whether the sponsor understands the structural mechanics of LMM debt. Three mechanics need explicit modeling: senior debt with mandatory amortization plus excess-cash-flow sweep, SBIC sub-debt with PIK accrual into principal, and the FCCR plus total leverage covenant tests period by period. Each mechanic is a separate row block in the debt schedule.
Senior debt — unitranche on a 3.5x leverage profile
The senior debt sizing is driven by the lender's leverage policy, which for LMM 2026 is typically 3.0x to 4.0x EBITDA on a unitranche commitment. 2025 unitranche leverage trended below 4.5x debt-to-EBITDA in the broader middle market per Capstone Partners' Q4 2025 Middle Market Leveraged Finance Report, and the LMM (sub-$10M EBITDA) tier typically sits 0.5x to 1.0x below the broad mid-market average — meaning 3.0x to 3.5x is realistic for a $5M EBITDA business services platform. Pricing in 2026: SOFR + 425-475 bps for upper middle market, with LMM pricing 50-100 bps wider — so SOFR + 525-575 bps is realistic for a $5M EBITDA borrower, all-in 9.75-10.25% at SOFR ≈ 4.75%. 81% of direct lending LBOs had spreads below 550 bps in 2025 per the same Capstone Q4 2025 report — the LMM tier is at the wider end of that distribution.
The amortization profile typically runs 1% per year mandatory plus an excess-cash-flow sweep. The cash sweep mechanic is critical to model correctly — excess cash flow (free cash flow after mandatory debt service) sweeps to senior principal at a percentage tied to total leverage. Below 4.0x leverage the sweep typically drops to 0%; between 4.0x and 4.5x the sweep is typically 50%; above 4.5x the sweep is typically 75%. Sponsors who omit the cash sweep mechanic overstate ending leverage and understate effective cash available for distributions.
SBIC subordinated debt — 1.0x leverage with PIK accrual
The SBIC tranche sits between senior and equity. Sizing on a $5M EBITDA platform is typically 1.0x to 1.5x EBITDA — pushing above 1.5x typically requires either a non-SBIC mezzanine partner or accepting equity-heavy preferred structures. Pricing for SBIC sub-debt in 2026: 8-11% cash plus 1-3% PIK = 11-14% all-in coupon plus an 8-12% warrant kicker valued at roughly 1-2% additional yield over the 5-year tenor. March 2026 SBA standard debenture pooling rate: 4.626% per SBIA's March 2026 pricing announcement, with a 0.25% standard or 0.96% accrual annual fee depending on debenture type. This is the SBA's cost to the SBIC fund, not directly the sponsor's cost — but it flows through to the SBIC's pricing posture on new deals.
The PIK accrual mechanic is the second-most-common modeling mistake (behind hardcoded waterfalls). PIK interest compounds into the principal balance, meaning the sub-debt ending balance grows over time even though the company is current on cash interest. Sponsors who treat PIK as cash interest understate the ending balance, overstate the equity bridge, and inflate sponsor returns at exit. The TCW research on PIK structures from August 2025 confirms PIK accrual typically lands at 4-6 percentage points compounding over the holding period — material to MOIC outcomes. Per TCW's PIK research from August 2025, 8% cash + 6% PIK is a common structure that eases cash burden in early years while the PIK compounds into a larger ending balance.
Covenant tests period by period
The debt schedule must compute three covenant tests every period: fixed charge coverage ratio (FCCR), total leverage, and senior leverage. FCCR (EBITDAR / interest + rent + required principal payments) typically needs to maintain 1.10x to 1.25x per typical LMM covenant packages. Total leverage typically caps at 5.0x to 5.5x. Senior leverage typically caps at 3.5x to 4.0x. A separate row in the debt schedule should show the dollar cushion at each test — the dollar amount by which the company is above or below the covenant threshold — so capital partners and the lender's credit team can see at a glance which quarter the company might trip a covenant.
The covenant cushion stress test
Run a 12-quarter forward forecast against each covenant with three scenarios: base case, downside (-15% EBITDA), and stress (-25% EBITDA). The scenario where any covenant trips below its floor for 2 or more consecutive quarters should be flagged in red. Lenders typically include a 1-quarter cure period plus a 2-quarter equity cure right (the sponsor can contribute additional equity to cure a covenant trip), but cumulative covenant trips beyond 4 quarters typically trigger acceleration. Sponsors who run only the base case and skip the downside hide the structural risk capital partners need to see.
Debt schedule documentation in the data room
Senior debt commitment letter, SBIC term sheet with debenture covenant package, intercreditor agreement, equity LLC operating agreement, and the financial model debt schedule itself all sit in the capital partner room post-soft-quote. Peony Data Room at $52/admin/month supports AI auto-indexing that organizes these debt documents alongside the model in under 3 minutes — so when the SBIC partner walks in for diligence on day 7 of post-LOI, the debt schedule is the second click after the cover page. See our SBIC for IS playbook for the full 8-stage SBIC sub-debt access path and our LOI playbook for the broader 90-day timeline.
How Does the IS Equity Waterfall Actually Calculate?
The equity waterfall is Tab 5 and the place where every capital partner runs the math themselves. The waterfall must be formula-driven, not hardcoded — capital partners flex the pref, the catch-up, and the promote tiers in real time during diligence, and a hardcoded waterfall forces a manual rebuild for every iteration. The modal IS waterfall in 2025-2026 runs four sequential tiers based on synthesis of Citrin Cooperman 2025, Verivend, Acquisition Stars, and Orono Capital Partners. Confirm the specific tiers against your capital partner's term sheet — these are modal, not universal.
Tier 1 — Return of Capital (100% to LPs and Sponsor Pro Rata)
Every dollar of exit proceeds flows back to all equity holders pro rata to their original equity commitment until each holder receives 100% of their original capital back. On a $9M total equity raise (lead $6.5M + co-invest $1.5M + sponsor GP commit cash + closing fee rollover $0.7M + management rollover $0.3M), the first $9M of exit proceeds returns capital. No carry, no promote, no priority — just dollar-for-dollar return.
Tier 2 — Preferred Return (8% Cumulative Compounded)
After all equity holders receive their original capital, the next dollars flow to LPs (lead capital partner + co-invest + management rollover) at the preferred return rate. The modal IS pref is 8% cumulative compounded annually — 63% of Citrin Cooperman 2025 respondents report the 8-9.9% pref range, consistent since 2019. The pref accrues annually on the original equity contribution and compounds, meaning a 5-year hold at 8% pref yields 1.469x cumulative pref before any additional distributions.
The sponsor's GP commit typically receives the same 8% pref as the LPs — the sponsor's pro-rata equity participates pari passu with the LPs at the pref level. The catch-up (Tier 3) is what creates the sponsor's promote upside above pref.
Tier 3 — Catch-Up (100% to GP until GP Receives 20% of Total Profits)
After LPs receive their pref, the next dollars flow 100% to the GP (sponsor) until the GP has received 20% of total profits to date — meaning the GP catches up to a 20% promote on the cumulative profits already distributed. The catch-up structure is dominant in IS deals — 74% of IS now use a full catch-up (100% to GP) per Citrin Cooperman 2025, up from 61% in 2019. The remaining 26% use either no catch-up or a partial 50/50 catch-up.
The catch-up math: if LPs receive $3M in pref distributions, the catch-up tier flows 100% to GP until GP receives $750K (because $750K of total $3.75M distributions = 20%). This $750K is the GP's catch-up share of the pref tier proceeds.
Tier 4 — Tiered Promote (Most Common LMM IS Structure)
After catch-up, the remaining proceeds flow under tiered promote. The modal LMM IS tiered promote structure (representative tiers per Acquisition Stars and Verivend) is:
- 20% to GP / 80% to LPs up to 2.0x MOIC
- 25% to GP / 75% to LPs from 2.0x to 3.0x MOIC
- 30% to GP / 70% to LPs above 3.0x MOIC
The hurdle metric is split — 50% of IS deals use MOIC-only as the primary hurdle (up from 27% in 2019), 22% use a hybrid MOIC plus IRR (up from 16% in 2019), and 20% use IRR-only per Citrin Cooperman 2025. For a $30M EV / $5M EBITDA platform exiting at 7.5x EBITDA × $7M trough exit EBITDA = $52.5M EV (a 1.75x EV expansion plus modest EBITDA growth), the MOIC tier crossings happen at specific cumulative distribution levels you compute period by period in the waterfall.
Achieved Promote — 64% of IS Now Reach 25% at the Highest Hurdle
64% of IS now achieve 25%+ carry at the highest hurdle in 2025 (up from 37% in 2019) per Citrin Cooperman 2025. The market has shifted materially toward sponsor-friendly economics over the past 5 years — driven by tighter capital partner competition, better IS performance data, and the structural shift toward MOIC-primary hurdles that favor absolute cash returns.
The waterfall implication: model your tiered promote with realistic upper-tier breakpoints. The market today supports 25-30% promote at the 3x+ MOIC tier — a sponsor pitching 20% flat at all tiers is leaving promote on the table; a sponsor pitching 50% at 4x+ tiers is signaling unrealistic expectations. The modal 20% / 25% / 30% tiered cascade with a 2x and 3x MOIC breakpoint is the sponsor-friendly structure capital partners will fund.
Sponsor Economics Beyond the Waterfall — Closing Fee, Management Fee, GP Commit
The waterfall is one of three sponsor economic levers. The closing fee at acquisition (56% of IS charge 2% of EV per Citrin Cooperman 2025), the annual management fee (69% of IS use 5% of EBITDA, 54% receive $251K-$500K annually per Citrin Cooperman 2025), and the promote together comprise total sponsor compensation. On a $30M EV / $5M EBITDA platform with a 5-year hold and a 3x MOIC exit at $30M of equity proceeds:
- Closing fee: $600K (2% of $30M EV) at close
- Management fee: $250K × 5 years = $1.25M cumulative
- GP commit return: $0.3M × 3x = $0.9M (pro-rata equity return)
- Closing fee rollover return: $0.4M × 3x = $1.2M (pro-rata equity return)
- Promote at 25% of profits over 2x MOIC: ~$1.5M-$2.5M depending on tier crossings
Total sponsor economics at 3x MOIC exit: roughly $5.5M-$6.5M on a $30M EV deal — the math compounds materially on roll-ups and repeat platforms. See our capital raising playbook for the full economic terms negotiation playbook covering pre-LOI soft-circling, term sheet language, and repeat-relationship cultivation.
How Do You Run the Sensitivity Analysis Capital Partners Demand?
Sensitivity is Tab 6 and the place where capital partners pressure-test the sponsor's confidence in the base case. A capital-partner-grade sensitivity tab runs at minimum a 2-axis table (entry multiple × exit multiple) with a third dimension on hold period, plus a discrete down-case stress test combining EBITDA decline, multiple compression, and hold extension. Sponsors who ship only the base case signal to capital partners that they are hiding the bear case — which is precisely the case the IC will model independently, often with worse assumptions than the sponsor would have presented voluntarily.
The 2-Axis Sensitivity Table
The standard layout is entry multiple as the column axis (range typically -1.0x to +1.0x of the base) and exit multiple as the row axis (range typically -1.5x to +1.5x of the base). The cell value is 5-year IRR or MOIC, depending on which is the primary hurdle. Per Multiple Expansion's advanced LBO modeling guidance, the table should:
- Center the base case in the middle of the grid
- Shade cells where IRR drops below the 8% pref threshold (red)
- Shade cells where MOIC drops below 1.0x (dark red — equity wipeout)
- Bold the base case cell
For the $30M EV / $5M EBITDA worked example with entry at 6.0x and exit at 7.5x, the 2-axis grid runs entry at 5.5x / 6.0x / 6.5x columns and exit at 6.0x / 7.5x / 9.0x rows. The base case (6.0x entry, 7.5x exit) sits at the center; the bull case (6.0x entry, 9.0x exit) sits at the top-right; the bear case (6.5x entry, 6.0x exit) sits at the bottom-right.
The Down-Case Stress Test
Per Wall Street Oasis sensitivity threads and Financial Edge's sensitivity training, the down-case stress combines three flexes:
- Multiple compression — exit multiple at -1.0x to -1.5x of entry (e.g., enter at 6.0x, exit at 4.5-5.0x)
- EBITDA decline — year-3 EBITDA at -15% to -25% versus base case (i.e., trough at $3.75M-$4.25M on a $5M base)
- Hold extension — add 24 months to base hold; show how IRR decays from a 5-year exit to a 7-year exit
The all-three-at-once stress test typically lands at 0.8x-1.4x MOIC with single-digit IRR — and this is the case capital partners model first when reviewing the deck. Sponsors who pre-build this case explicitly demonstrate their downside discipline; sponsors who omit it force the capital partner's IC to model it independently with assumptions that may be more punitive than the sponsor would have accepted.
IRR Floors and MOIC Targets Capital Partners Demand
Capital partners typically require 30%+ IRR on the base case per CapitalPad's stated screening floor — the platform deploys $1M-$2.5M equity checks and explicitly screens for 30%+ base-case IRR. The LBO industry standard is 20-30% IRR / 2.0x-4.0x MOIC over a 3-7 year hold per Ryan O'Connell CFA's LBO model fundamentals and iBInterviewQuestions sensitivity scenarios. The sponsor minimum threshold is 20-25% IRR — most won't move on a deal projecting below that level per Multiple Expansion's LBO modeling guidance.
The realistic 2025-2026 IS base case range is 22-28% IRR — sub-25% pencil rarely closes; above 28% is typical pitch-side optimism that capital partners discount during diligence. A modal IS base case of 25% IRR / 3.0x MOIC over a 5-year hold is the realistic sweet spot. For exit MOIC distributions: 68% of completed IS exits returned 3x MOIC or more, and 30%+ returned 5x or greater per Citrin Cooperman 2025 cited via Smash.vc — meaning the sponsor's pitched 3x MOIC base case is realistic against historical IS exit data.
Hold Period Assumptions
The modal IS hold period is 5 years base / 6 years flex — Citrin Cooperman 2025 does not publish hold period directly, but Orono Capital Partners' IS economics guide and Smash.vc's IS overview both confirm 5-7 years as the modal range. Build the model with a 5-year base case exit and a discrete 7-year flex case showing IRR decay — a 25% base IRR at year 5 typically decays to 18-20% at year 7 because the additional 2 years of holding earn at a marginal 8-12% return rather than the deal's compounding rate.
Sensitivity Tab Discipline
Three disciplines distinguish a capital-partner-grade sensitivity tab from a sponsor-grade one. First, the 2-axis layout with shaded threshold cells so the reader finds the down case in 30 seconds. Second, the discrete combined stress test that flexes EBITDA, multiple, and hold simultaneously — not three separate tables. Third, the explicit IRR floor flag showing which cells fall below the LP pref — capital partners look there first. Peony Business at $30/admin/month supports page-level analytics showing which capital partners spent time on the sensitivity tab versus skipped it — a signal that helps you prioritize the structural questions for follow-up calls.
What Are the Five Excel Mistakes That Get Your Model Rejected?
Five Excel mistakes get IS financial models rejected by capital partners in week 1 of post-LOI diligence. Each mistake is mechanical, each is fixable, and each has a specific signature that an experienced IC catches in 60 seconds. Synthesis from Multiple Expansion, UpLevered, Edward Bodmer's circular reference guidance, Wall Street Oasis, and FinanceInterviewCoach — every mistake below has a public, citeable origin.
Mistake 1 — Hardcoded Promote Tiers Instead of Formula-Driven Cascade
Capital partners want to flex the pref rate, the catch-up structure, and the promote tiers in real time during diligence — a hardcoded waterfall forces a manual rebuild for every iteration. The signature: a waterfall tab where the GP catch-up amount is a typed-in number (e.g., $750K) instead of a formula referencing the assumptions tab. The fix: build the waterfall cascade as a SUMPRODUCT or nested IF formula referring to the cumulative distribution at each tier and the assumptions-tab inputs for pref rate, catch-up structure, and tiered promote percentages. The Multiple Expansion equity waterfall walkthrough shows the formula architecture in detail. Hardcoded waterfalls are the single most common reason IS models get sent back for rebuild — and the sponsor who fixes this in 4 hours saves a week of post-LOI back-and-forth.
Mistake 2 — Circular Reference Handling Disabled or Unflagged
LBO models contain inherent circularities — interest expense ↔ cash sweep ↔ debt balance is the canonical example. Models either disable Excel's iterative calculation (and the model breaks because the circularity cannot resolve) or leave iterative calculation on without a "circ break" toggle that flushes the circularity for stability checks. The signature: a debt schedule with #VALUE! or #REF! errors in the interest expense rows, or worse, a model that appears to compute correctly but is actually returning stale values from a half-resolved iteration. The fix: build a "circ break" cell that flushes circular references to zero when toggled on, allowing the user to verify the model converges cleanly when circularity is turned back on. Edward Bodmer's guidance on circular references in corporate finance and FinanceInterviewCoach's LBO circular reference primer cover the circ-break technique in detail. Wall Street Oasis discussions confirm this is the most-reported model mechanic that trips first-time PE associates.
Mistake 3 — Forgotten Cash Sweep / Revolver Logic
Excess cash should auto-pay down debt; a cash deficit should auto-draw from the revolver. Models without sweep logic overstate ending leverage and understate exit IRR because the cash that should have paid down senior debt is sitting on the balance sheet idle. The signature: a debt schedule with senior principal outstanding flat across the holding period, a revolving credit facility line that never moves, and cash on the balance sheet ballooning over time. The fix: build the cash sweep mechanic as a formula tied to leverage thresholds — below 4.0x leverage the sweep is 0%, between 4.0x and 4.5x the sweep is 50%, above 4.5x the sweep is 75%. The revolver draws when cash drops below a minimum operating threshold (typically $500K-$1M for a $5M EBITDA business). UpLevered's LBO modeling traps walks through the cash sweep mechanic step by step.
Mistake 4 — PIK Interest Not Compounding Into Principal Balance
SBIC sub-debt and non-SBIC mezzanine with PIK structures accrue interest to the principal balance rather than paying it in cash. Models that treat PIK as cash interest understate the ending balance, overstate the equity bridge, and inflate sponsor returns at exit. The signature: a debt schedule where the SBIC tranche balance stays at $5M for the entire 5-year hold even though the structure is 8% cash + 4% PIK = 12% all-in. After 5 years of 4% PIK compounding, the actual ending balance should be roughly $5M × 1.04^5 = $6.08M — meaning the equity at exit is $1.08M lower than the unsophisticated model shows. The fix: build the PIK accrual as a separate formula adding the PIK rate × beginning principal to ending principal each period. TCW's PIK research from August 2025 confirms 8% cash + 6% PIK is a common structure that compounds materially over the holding period.
Mistake 5 — Management Rollover Equity Double-Counted in Sources & Uses
Rolled equity is a non-cash source — it reduces the new sponsor cash equity check by allowing the existing CEO and CFO to retain a portion of their existing equity stake. Drafts that add rolled equity to the sponsor cash check overstate the equity raise (inflating the lead capital partner's commit) and understate the sponsor commit percentage (signaling weaker alignment). The signature: an S&U table with rollover equity listed as a separate line under cash sources alongside the sponsor GP commit, summing to a total that exceeds the actual cash equity needed at close. The fix: list rollover equity as a discrete non-cash source with a footnote clarifying treatment, and reconcile total cash sources to the actual cash equity raise at close. UpLevered's LBO modeling traps and standard PE training material from Wall Street Prep both confirm this is the third-most-common modeling mistake junior PE associates make on their first IS deal.
Bonus Mistake — Working Capital Peg Not Modeled
Buyers and sellers fight hardest on net working capital peg plus adjustment, but many IS models bury the peg as a passive line. The peg variance and the dollar-for-dollar purchase price adjustment at close are the second-largest source of post-close friction (after waterfall disputes) per Capstone Partners' net working capital in M&A guide and Quazar's NWC target analysis from June 2025. The fix: build a discrete working capital schedule as Tab 8 of the diligence-ready version, showing the rolling 12-month average NWC as the peg, the variance band (typically ±5%), and the dollar-for-dollar adjustment mechanism. Prairie Capital's NWC adjustment guidance covers the standard structures.
Run a self-audit pass on every IS model before you ship it to capital partners. Each of these mistakes takes 2-4 hours to fix and saves 5-10 days of post-LOI diligence back-and-forth — a 25-50x ROI on the audit time. The audit checklist: open the waterfall tab, verify it is formula-driven; open the debt schedule, verify cash sweep and PIK accrual mechanics; open the S&U, verify rollover is non-cash; toggle iterative calculation off, verify the model breaks cleanly; toggle iterative calculation on, verify it converges; and walk the working capital schedule with a critical eye. See our LOI playbook for the full 90-day post-LOI timeline and where these audit fixes fit into the diligence sequence.
What Are the Three IS Model Patterns Capital Partners See Most Often?
Three distinct IS model patterns recur across LMM deals in the $5M-$15M EBITDA range, and each pattern carries a structural modeling lesson that distinguishes the winning model from the losing one. The patterns are platform-level archetypes — within each pattern, the specific deal economics vary, but the model architecture lesson is consistent. Synthesis from observed deal flow in the IS-partner SBIC universe and recent fund-level data confirms these three are the dominant patterns capital partners see in 2025-2026.
Pattern 1 — Services Roll-Up With Tuck-Ins
The services roll-up is the modal IS pattern in 2025-2026. The platform target carries $5M-$10M EBITDA at acquisition; the sponsor plans 3-6 tuck-in acquisitions over a 24-36 month integration window, growing the platform to $15M-$30M EBITDA by exit. The structural model lesson: build each tuck-in target as a discrete input tab and consolidate at the platform level, rather than building a single combined model that loses fidelity on tuck-in-specific assumptions.
The capital stack mechanics for roll-ups need explicit modeling. The platform's senior lender typically expands the unitranche commitment via accordion or delayed-draw provisions to fund tuck-ins; the SBIC sub-debt partner re-ups at each closing under existing debenture capacity. 86% of IS plan to close 1-2 platform deals over the next 18 months per Citrin Cooperman 2025, and the SBICs that explicitly support roll-ups include Plexus Capital Fund VII ($977M with leverage closed September 2025 with explicit roll-up coverage), Argosy Private Equity (which merged Pulse Final Mile + Diverse Logistics in February 2026 demonstrating roll-up capacity), and Tecum Capital Fund IV ($325M closed July 2025 with multi-acquisition platform support).
The synergy capture model is the second key element. Realistic LMM synergy capture is 8-15% of acquired EBITDA over 12-24 months — purchasing leverage, SG&A consolidation, technology platform unification, and revenue cross-sell. Sponsors who model 20%+ synergy capture lose credibility because capital partners cannot verify the math. Build synergy capture as a separate add-back schedule per tuck-in with explicit dollar attribution to each lever — purchasing leverage typically captures 2-4% of acquired revenue (volume discounts on COGS), SG&A consolidation typically captures 3-5% of acquired SG&A (overlapping back-office functions), and technology platform unification typically captures 1-3% of acquired SG&A (license consolidation). See our distribution and logistics capital partners directory for sponsors who explicitly fund roll-ups in this size range.
Pattern 2 — Corporate Carve-Out
The corporate carve-out is the second-most-common IS pattern — a Fortune 1000 corporate parent divests a non-core business unit at $10M-$25M EBITDA, and the IS acquires the unit with senior debt + sub-debt + equity. The structural model lesson: carve-out models need a stand-alone P&L bridge from corporate-allocated overhead to true stand-alone overhead, plus a 100-day separation cost model that captures the one-time IT, finance, HR, and legal stand-up costs.
The corporate-allocated overhead bridge is typically 200-400 basis points of revenue — meaning the carved-out business unit's reported EBITDA understates true stand-alone EBITDA by roughly 2-4% of revenue. On a $50M revenue / $5M EBITDA carve-out, the stand-alone EBITDA bridge typically lifts EBITDA by $1M-$2M to $6M-$7M. Build this bridge explicitly with line-item attribution — IT services, HR, finance, legal, executive comp allocation — and verify each line with the QoE provider. Axial 2025 IS Report found 27% of all closed Axial deals went to IS in 2025, and corporate carve-outs are over-represented in that distribution.
The 100-day separation cost model is the second key element. One-time costs include IT system migration ($150K-$500K), HR and benefits transition ($100K-$300K), legal entity formation and licensing ($50K-$150K), and rebranding ($100K-$500K). Total 100-day separation cost: typically $400K-$1.5M depending on complexity, paid out of the working capital line in months 1-12 post-close. Sponsors who omit the separation cost model overstate post-close cash flow and trip working capital covenants in the first 6 months.
Pattern 3 — Recurring Revenue Platform (SaaS / Subscription / Membership)
The recurring revenue platform is the third pattern — software, subscription consumer, or membership-based business with $3M-$8M EBITDA, high gross margin (60-80%), and net revenue retention above 100%. The structural model lesson: recurring revenue models need a cohort-based revenue build (gross adds, churn, expansion) instead of a top-down growth percentage, plus a clear bridge from GAAP revenue to ARR (annual recurring revenue) for capital partner valuation comps.
The cohort revenue build is the first key element. Build new customer acquisition by cohort (Q1 2026 cohort, Q2 2026 cohort, etc.) with each cohort carrying its own gross retention rate (typically 90-95% annually for SaaS, 70-85% for subscription consumer) and net revenue retention rate (typically 105-120% for healthy SaaS, 95-110% for subscription consumer). The cohort model is materially more accurate than a top-down "20% revenue growth" assumption because retention dynamics compound — a business with 95% gross retention and 110% NRR grows organically at 4.5% per year before any new customer acquisition.
The ARR bridge is the second key element. Capital partners value recurring revenue businesses on EV/ARR multiples (typically 3-8x ARR for LMM SaaS) in addition to EV/EBITDA — and the bridge from GAAP revenue to ARR needs to show the seasonality adjustment, the deferred revenue treatment, and the implied billings calculation. Sponsors who skip the ARR bridge force capital partners to compute it independently, slowing diligence by 5-7 days.
The recurring revenue platform pattern is over-represented in Citrin Cooperman 2025 data showing 44% of IS now target companies with $10M+ EBITDA (up from 4% in 2017) — recurring revenue businesses with $3M-$8M starting EBITDA grow into the $10M+ tier through cohort compounding faster than asset-heavy services businesses. See our tech and software capital partners directory for sponsors who explicitly fund recurring revenue platforms in this size range.
What These Three Patterns Teach the Next IS Sponsor
The pattern lesson is consistent across all three. Build the model around the pattern's structural risk, not around a generic LBO template. Roll-ups need tuck-in fidelity and synergy attribution; carve-outs need stand-alone bridge and separation costs; recurring revenue needs cohort retention and ARR bridge. Sponsors who match the model architecture to the pattern win credibility with capital partners in the first 30 minutes of model review; sponsors who ship a generic LBO template force the IC to ask the structural questions the model should have answered upfront. See our deal book guide for how the model fits into the broader 10-section capital partner pitch document, and our capital raising playbook for the broader 8-stage capital raising workflow.
Financial Model — By the Numbers (2025-2026)
The state of IS model economics, capital stack mechanics, and waterfall structures in 2025-2026.
| Metric | Stat | Source |
|---|---|---|
| Citrin Cooperman 2025 IS Report respondents | 172 (151 sponsors + 21 capital providers) | Citrin Cooperman 2025 |
| IS planning 1-2 platform deals next 18 months | 86% | Citrin Cooperman 2025 |
| IS targeting >$10M EBITDA companies (vs 4% in 2017) | 44% | Citrin Cooperman 2025 |
| IS charging 2% closing fee on EV | 56% | Citrin Cooperman 2025 |
| IS using full catch-up (vs 61% in 2019) | 74% | Citrin Cooperman 2025 |
| IS achieving 25%+ carry at highest hurdle (vs 37% in 2019) | 64% | Citrin Cooperman 2025 |
| IS using MOIC as primary hurdle (vs 27% in 2019) | 50% | Citrin Cooperman 2025 |
| All Axial closed deals going to IS (#1 buyer type, vs 20% PE funds) | 27% | Axial 2025 IS Report |
| IS exits returning 3x MOIC or more | 68% | Citrin Cooperman 2025 via Smash.vc |
| IS exits returning 5x MOIC or greater | 30%+ | Citrin Cooperman 2025 via Smash.vc |
| IS relying on family offices as primary capital | 62% | Citrin Cooperman 2025 |
| CapitalPad base case IRR floor for IS funding | 30%+ | CapitalPad |
| March 2026 SBIC standard debenture pooling rate | 4.626% + 0.25% annual fee = ~4.88% all-in | SBIA March 2026 |
| 2025 unitranche leverage | below 4.5x debt-to-EBITDA | Capstone Q4 2025 Middle Market Leveraged Finance |
| Direct lending LBOs with spreads below 550 bps in 2025 | 81% | Capstone Q4 2025 |
| Mezzanine 2025 cash + PIK structure (TCW research) | 8% cash + 6% PIK common | TCW PIK Research August 2025 |
Bottom Line: How Should You Build the IS Financial Model?
Build the IS financial model in the order capital partners read it, not the order Excel naturally lays it out. Start with the cover and assumptions tab, then sources and uses, then the integrated 3-statement operating model, then the debt schedule with explicit cash sweep and PIK accrual, then the formula-driven waterfall cascade, then the sensitivity tables with the down-case stress test, then the one-page investor memo. Add three diligence-ready tabs for Stage 2 release: working capital schedule, tax and QSBS analysis, and comparable transactions appendix. Total: 10 tabs at the diligence-ready stage, 7 tabs lean for the initial Stage 1 release.
The five Excel mistakes to avoid before shipping: hardcoded promote tiers (build the waterfall as formula-driven cascade), unflagged circular reference handling (build a "circ break" toggle), missing cash sweep logic (model excess cash flow flushing to senior principal), PIK interest not compounding into principal balance (model PIK accrual as separate formula adding to ending balance), and management rollover equity double-counted in sources and uses (treat rollover as non-cash source). Each mistake takes 2-4 hours to fix and saves 5-10 days of post-LOI diligence — a 25-50x ROI.
Match the model architecture to the deal pattern. Roll-ups need tuck-in fidelity, synergy attribution by lever, and discrete senior debt accordion modeling. Corporate carve-outs need stand-alone overhead bridge and 100-day separation cost modeling. Recurring revenue platforms need cohort-based revenue build with retention dynamics and ARR bridge. Sponsors who match the architecture to the pattern win credibility in the first 30 minutes of model review.
Set the base case at the realistic 22-28% IRR / 3.0x MOIC range over a 5-year hold — 25% IRR / 3x MOIC is the modal sweet spot per the historical IS exit data showing 68% of exits returned 3x+ MOIC. CapitalPad's 30%+ base case IRR floor is the high end; sub-25% rarely closes. Model the down-case stress test combining EBITDA -20%, multiple compression -1.5x, and hold +2 years — this is the case capital partners model independently, often with worse assumptions than you would have presented voluntarily.
Run Peony Data Room at $52/admin/month for the financial model workflow. NDA-gated rooms with AI auto-indexing organize the model PDF, debt schedule, waterfall exhibit, and sensitivity output in under 3 minutes. Dynamic watermarks embed each capital partner's identity on every page of the financial model, page-level analytics show which sections each capital partner reviewed, AI Smart Q and A handles model questions with cited cell references in under 60 seconds, and e-signatures execute the equity LLC operating agreement, sub-doc, and management rollover paperwork inside the room. Personalized sharing links gate access per capital partner so parallel competitions stay clean. Total cost: $52/admin/month versus $25K+/deal for Datasite — the economics of the IS model fit Peony's pricing structure rather than the legacy enterprise VDR pricing structure.
For the broader IS workflow, see our hub on independent sponsors, the LOI playbook covering the 90-day post-LOI timeline, the data room checklist covering the 42 documents organized in 3 staged access tiers, the deal book guide covering the 10-section capital partner pitch document, the capital raising playbook covering the 8-stage workflow from rolodex to repeat relationship, and the SBIC for IS playbook covering the 8-stage SBIC sub-debt access path. The financial model is the single deliverable that ties all of these together.