
10 M&A Facts That Actually Matter in 2026: A Data-Backed Decade Review

Co-founder at Peony. Former M&A at Nomura, early-stage VC at Backed VC, and growth-equity / secondaries investor at Target Global. I write about investors, fundraising, and deal advisors from the deal-side perspective I spent years in.
If you care enough about M&A to click this, you are probably not looking for hype. You want to understand what actually happened in deals over the last decade and what it means for your next deal in 2026 — whether you are a founder considering an exit, a corp dev leader prioritizing pipeline, a PE partner pacing deployment, or an attorney building a case for the seller's narrative.
I'm Sean — I spent time on the M&A side early in my career at Nomura before moving into venture capital at Backed VC and Target Global, then co-founding Peony. The ten facts below are the ones that have actually changed how I think about deals in 2026. They're data-backed, sourced from the institutions that track this seriously (PitchBook, Bain, McKinsey, PwC, KPMG, BCG), and arranged so you can connect them to your own strategy without memorizing every number.
This post covers macro trends and decade-level data — value cycles, PE share of M&A, sector mix shifts, geographic concentration, SPAC collapse. If you want specific named deal case studies (Disney-Fox $71.3B, Microsoft-Activision $68.7B, Google-Wiz $32B, the 20 largest tech acquisitions of the decade), see our companion piece: 20 Biggest Tech Acquisitions: $7.5B to $71B. The two work together — macro here, micro there.
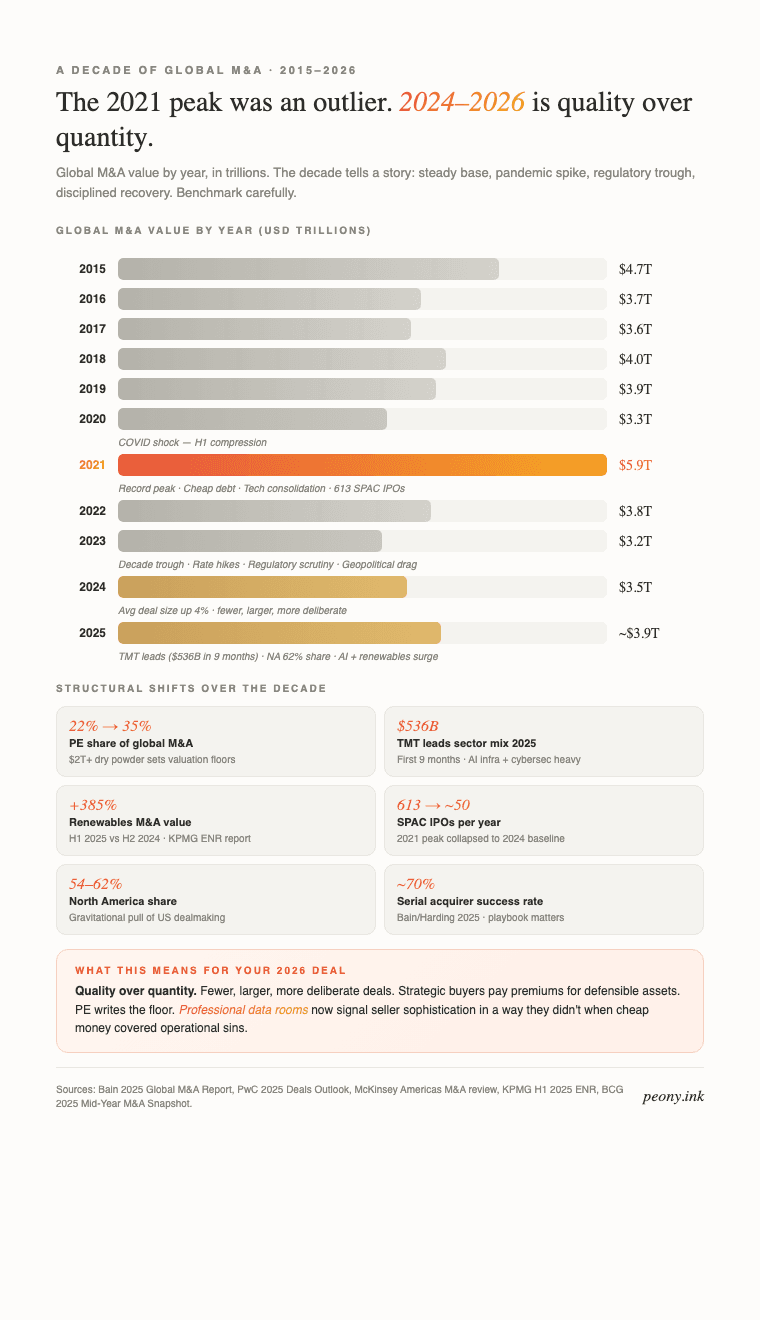
Global M&A value 2015-2026. The 2021 peak was an outlier, not a baseline. The 2023 trough was real. 2024-2026 is a selective quality-over-quantity cycle.
1. 2021 was the biggest M&A year in history — and an outlier
After the initial COVID shock, 2021 turned into a once-in-a-lifetime surge.
- Global M&A value hit around $5.8-$5.9 trillion, the highest on record (PwC Global M&A Industry Trends 2022).
- PwC counted more than 62,000 deals that year, with disclosed values of $5.1 trillion and 130 megadeals over $5 billion.
Low interest rates, abundant liquidity, pandemic-accelerated digital transformation, and a rush to buy AI and cloud capabilities created a perfect storm. If your mental baseline for "normal" M&A was set during 2021, that is important context for anything you're planning in 2026 — it really was an outlier, not a benchmark.
2. Two years later, 2023 was the weakest M&A year in a decade
The comedown was real and fast.
- Bain estimates that 2023 global M&A value dropped to about $3.2 trillion, down 15% from 2022 and the lowest level in ten years (Bain Global M&A Report 2024).
- Skadden notes that rising rates, inflation, geopolitical tensions, and tougher antitrust regulators combined to depress volumes further after an already slower 2022.
By mid-2023, some regions were seeing deal volume down 20-30% year-on-year. The lesson: macro conditions and regulatory mood can reset the deal environment shockingly fast — faster than most corp dev plans assume.
3. 2024-2026: fewer deals, bigger deals, slow recovery
Since the 2023 low, the story has been "cautious recovery" rather than a new boom.
- One major forecast put 2024 deal value at around $3.5 trillion, up roughly 15% from 2023 and similar to the mid-2010s.
- In 2024, another study found global M&A just over $3 trillion, about 11% higher than 2023, but still well below historic peaks.
- Deal counts stayed under pressure, but average global deal value rose about 4% in 2024, to roughly $443 million — quality, not quantity.
In 2025, the pattern continues:
- By August 1, 2025, global M&A had reached $2.6 trillion, the strongest first seven months since 2021, even though the number of deals was down 16%.
- Another mid-year snapshot shows volume down 9% in H1 2025 vs H1 2024, but values up 15%.
Translation: fewer, larger, more deliberate deals — especially in tech, infrastructure, and AI. 2026 is tracking as a continuation of this cycle, not a reversal. Use Peony for M&A data rooms with AI-powered Smart Q&A and page-level analytics to streamline the diligence processes that now take 2-3x longer than they did in 2021.
4. Private equity has become one-third of global M&A
Over the past decade, buyout funds have gone from "important" to "central" in M&A.
- Recent analysis suggests PE-sponsored buyouts account for nearly 35% of global M&A by deal count this decade, with corporates responsible for the remaining approximately 65%.
- In the Americas, McKinsey reports PE's share of M&A volume at $398 billion (22%) in 2024, down from $865 billion (28%) in 2021, but still massive in absolute terms (McKinsey Global Private Markets Review 2025).
There is now so much dry powder in PE — over $2 trillion globally — that it effectively sets a floor under certain valuations and keeps competitive tension alive even when strategic buyers are cautious. For sellers, this means you have optionality; for corp dev teams, it means you're often bidding against a PE auction process rather than a single strategic peer.
5. North America quietly re-centered the M&A world
If you zoom out, one geographic pattern stands out in the last decade: the gravitational pull of North America.
- A 2024 review found the US alone represented about 54% of global M&A by value that year.
- In the first nine months of 2025, BCG estimates deals involving targets in the Americas totaled around $1.26 trillion, with North America accounting for about 62% of all global M&A activity.
Meanwhile, Europe and Asia have been much more mixed — Europe holding its own in some years, Asia-Pacific hitting decade-low deal values in others. For anyone running a global M&A strategy, that concentration of value matters: where you build relationships, where you expect competitive auctions, where your best buyer pools actually sit.
6. Tech, AI, and data infrastructure now dominate sector mix
The last decade saw technology move from "one sector among many" to the backbone of deal flow.
- By August 2025, technology, media, and telecom (TMT) deals were leading the market with about $536 billion in value for the first nine months, ahead of financials, real estate, and industrials.
- Another 2025 snapshot attributes much of the year-to-date surge in M&A to AI-related infrastructure and cybersecurity, with megadeals in data centers, chipmaking, and applied AI software.
The implication: even non-tech acquirers are increasingly buying tech, data, and AI capabilities rather than building them from scratch. If you are a corp dev leader at an industrial or consumer company, your pipeline should include at least 2-3 tech-adjacent targets. Secure document sharing platforms like Peony provide identity-bound access and watermarking for the kind of high-sensitivity technical diligence that AI and infrastructure deals require.
7. SPACs had a wild boom — and then a hard reset
If you lived through the SPAC mania, you know how surreal it felt. The numbers confirm it.
- In 2021, 613 SPAC IPOs raised over $160 billion, and SPACs made up roughly 64% of all US IPOs at the peak.
- Many de-SPAC companies then saw their share prices fall dramatically; one analysis puts the average drop around two-thirds from IPO levels.
- By 2024, activity had collapsed to around 50 SPACs per year, a tiny fraction of the peak.
In 2025 and 2026, some observers talk about a more disciplined "SPAC 4.0" era — higher-quality sponsors, better target selection, longer vetting periods. But the last decade will likely be remembered as a cautionary case study in easy money and structure-driven deals.
8. Energy transition and renewables deals have exploded
One of the most structural shifts in the last few years has been into energy transition and resource security.
- KPMG reports that in H1 2025, renewables deals in energy and natural resources saw deal volume up about 10% and deal value up almost 385% vs. the second half of 2024 (KPMG H1 2025 ENR Report).
- PwC's energy and resources outlook describes strategic M&A in this space as unlocking "value in motion" as companies reposition for rising demand and decarbonization.
If you overlay this with AI-driven electricity demand and grid pressures — data centers now pulling gigawatt-scale power, hyperscaler procurement contracts for renewable capacity, utility infrastructure M&A — you can see why data centers, power assets, and renewables developers are suddenly hot M&A targets for strategics and PE alike.
9. The "most deals fail" narrative is being updated
For years, you have probably heard the line that 70-90% of deals fail. Plenty of studies have suggested over half of acquisitions destroy value.
But more recent research is painting a more nuanced picture:
- A 2024 analysis of 40,000 deals over 40 years concluded that around 70-75% of acquisitions fail to meet objectives (synergy targets, integration milestones, accretion goals) — highlighting how hard value-creating M&A is at scale.
- Yet other work, including newer Bain/Harding research cited in 2025, argues that nearly 70% of mergers now succeed when measured over longer horizons and with better integration discipline among repeat acquirers.
Put simply: the average single-deal acquirer is still risky, but the best serial acquirers are bending the odds in their favor through playbooks, integration teams, culture alignment, and better target selection. Peony provides M&A data rooms with AI-powered Smart Q&A to improve the diligence and post-close tracking that separate successful deals from failed ones.
10. M&A's share of the real economy has shifted
One final macro fact that rarely gets discussed: M&A's weight relative to global GDP.
- Bain's 2025 global M&A report notes that 2024 deal value, while up vs. 2023, was historically low as a percentage of global GDP — more in line with mid-cycle levels than with the 2015 or 2021 peaks.
In other words, even after the post-COVID rollercoaster, M&A is not "everything" in the global economy. It is a powerful tool layered on top of organic growth, not a replacement for it. For corporate strategists, the implication is that organic execution and capital allocation discipline matter more than aggressive M&A in a cycle where deal values remain structurally lower as a share of the real economy.
What this means for your deal in 2026 (decision framework)
Different actors in the M&A ecosystem should read these ten facts through different lenses. Pick your row:
If you're a founder considering selling your company (Series B+, $10M-$150M revenue) — timing is reasonable, not optimal. 2026 is a selective buyer's market where quality sellers are rewarded. Prepare your financials, audit your metrics, run a real sell-side process, and expect 4-6 months from banker engagement to close. Don't benchmark your expected multiple against 2021 comps — they were anomalies.
If you're a corp dev leader — expect 2-3x longer diligence timelines than 2021. Budget for regulatory complexity (HSR, CFIUS, state privacy laws). Focus pipeline on TMT (especially AI-adjacent), energy transition, and cybersecurity where capital is flowing. Bring integration leads into diligence week 2, not week 12.
If you're a PE partner at a mid-market fund — bias toward add-ons over platforms. The interest-rate repricing has compressed platform deal economics, but your existing portfolio companies can acquire more aggressively. Run disciplined portfolio rotation — sell into hungry strategic bids in TMT and renewables while maintaining conviction on your remaining hold positions.
If you're an M&A attorney or investment banker — the quality-over-quantity cycle rewards professionals who run tight processes. Sellers who bring well-structured data rooms close faster and at better multiples. Insist on professional data room infrastructure before LOI, not a Google Drive folder — that signals first-time-seller and invites lowball offers.
If you're a serial acquirer building a long-term M&A capability — you're in the cohort that bends the 70% failure statistic in your favor. Invest in an integration function, cultural diligence, and post-close tracking. Your ROIC on M&A depends more on the playbook than any individual deal.
If you're raising a fund that will deploy into PE secondaries or co-invest — the structural shift toward PE as 35% of global M&A means GP-led secondaries, continuation vehicles, and co-invest opportunities will be meaningful deployment channels. See our family offices solution and hedge funds solution for adjacent workflows.
Why your data room is doing more work than you think in 2026
Every M&A process creates the same artifact: a link to the seller's materials. The question is whether that link is a signal of professionalism or a signal of amateur hour.
A Google Drive or Dropbox folder signals "first-time seller, inexperienced." It invites buyers to lowball on price because they assume they're dealing with an unsophisticated counterparty. It also creates diligence friction — your buyer-side attorneys spend 20 hours locating basic documents that should take 20 minutes, and confidence in the seller's operational rigor declines throughout.
A professional M&A data room does the opposite. It signals experience. It accelerates diligence throughput. It gives you, the seller's team, visibility into which buyers are actually serious (who opened the financial model? who spent 30 minutes on the cohort retention analysis? who forwarded the link to their IC?) versus who's just kicking tires.
This is the pitch for Peony specifically. M&A sellers are our sweet spot because four things matter more here than in most categories: page-level analytics on 500-1500 diligence documents; NDA gates and dynamic watermarks on genuinely confidential commercial data; AI auto-indexing that structures messy doc dumps into investor-ready folders in under 3 minutes; and Smart Q&A that routes buyer questions through AI drafts before your team approves each response — instead of fielding dozens of scattered emails through Google Drive. Business is $30/admin/month and Data Room is $52/admin/month — a fraction of the $15K-$25K per deal that enterprise VDRs charge, with analytics and AI workflows that Datasite and Intralinks don't match.
Not a competitor pitch. Just the honest shape of the tool I wish I had when I was sitting through M&A diligence reviews early in my career watching sellers share documents through raw Box links.
Related Resources
- M&A Data Room Complete Guide
- M&A Due Diligence Process Complete Guide
- Best M&A Advisors in Dallas — 14 Dallas-led boutiques active in 2024-2026 LMM deals
- Best M&A Advisors in Chicago — 18 Chicago boutiques across 4 deal-size tiers ($1M-$2B+ EV)
- Best M&A Advisors in Atlanta — 14 Atlanta boutiques across $1M-$300M EV (healthcare + ESOP specialty)
- Due Diligence Data Room Checklist
- Due Diligence Cost Breakdown
- Investment Due Diligence Checklist
- 20 Biggest Tech Acquisitions of the Last Decade
- Startup Due Diligence Guide
- AI Data Rooms vs Traditional Data Rooms (Data Room Trends)
- How to Share Confidential Documents Securely
- Tax Due Diligence Checklist
- Vendor Due Diligence Checklist
- IPO Readiness Checklist 2026: 10 Steps to Going Public — 202 US IPOs raised $44B in 2025; full company-side roadmap
- M&A Solution Page
- Private Equity Solution Page
- Due Diligence Solution Page
- Family Offices Solution Page
- Pricing
FAQ
I'm a founder considering selling my B2B SaaS company to a strategic buyer in 2026 — what does the current M&A market actually look like at my scale?
For founder-led B2B SaaS companies in the $10M-$150M revenue range, 2026 is a selective market — fewer tourists kicking tires, more strategic acquirers with real capital and conviction. The 2024 US B2B software M&A multiple median settled around 4.5-6.5x revenue for growing, profitable companies (down from 8-12x in 2021), and strategic acquirers are paying premiums for companies with clear defensibility and CAC-efficient growth. Your deal timeline will likely be 4-6 months from banker engagement to close, longer than the 2021 compressions. Before you go to market, prepare three things: a clean financial audit (ideally Big 4 or top regional firm), a data room that lets acquirers self-serve through 200-500 documents without emailing your banker every 10 minutes, and a clear CEO narrative on why sell-now versus raise-growth. Peony Data Room at $52/admin/month gives you the M&A-grade data room with AI auto-indexing, page-level analytics on which buyers are actually reading your financials versus skimming, dynamic watermarks with viewer identity, and NDA gates — the controls M&A attorneys expect, at a fraction of what Datasite charges for comparable-sized deals.
I work in corporate development at a $2B revenue tech company — how should I think about deal pipeline priority in 2026 given the sector shifts?
Corp dev priority in 2026 should follow the capital concentration: TMT deals led the first nine months of 2025 at approximately $536B in announced value, AI infrastructure and cybersecurity megadeals drove a disproportionate share of that, and renewables saw deal value up approximately 385% in H1 2025 versus H2 2024 per KPMG. If your company is in tech, prioritize AI-adjacent adjacencies (agents, data infrastructure, vertical AI) over defensive consolidation. If you're in energy or industrials, renewables and grid infrastructure are where capital moves. If you're in consumer, expect a slower cycle — consumer M&A has underperformed. For a corp dev team running 3-5 concurrent targets, the workflow bottleneck is usually diligence throughput, not sourcing. Peony Data Room at $52/admin/month lets you run parallel data rooms with per-target access controls, Smart Q&A that routes target questions through AI drafts before your team approves each response, and page-level analytics so you see which internal stakeholders (legal, finance, product) are actually reviewing which targets — something Google Drive shared folders cannot track.
I'm an M&A attorney at a mid-market firm — what's the realistic diligence-phase timeline for a 2026 tech M&A deal and what derails deals most often?
For a 2026 tech M&A deal under $500M enterprise value, expect 60-90 days from LOI to close on a clean process, stretching to 120+ days if diligence surfaces material issues. The three most common derailers I've seen are data room disorganization (buyer's attorney wastes 20 hours finding basic documents and loses confidence), surprise regulatory issues (CFIUS for cross-border, HSR antitrust thresholds got lower in 2024, state privacy laws create unexpected compliance exposure), and late-stage seller-side revenue recognition questions when buy-side accounting diligence probes ASC 606 judgment calls. Mitigate #1 by insisting on a professional data room before LOI — not a Google Drive link. Peony Data Room at $52/admin/month gives your client a data room with AI auto-indexing that structures 500+ documents in under 3 minutes, page-level analytics showing which buyer-side attorneys are actually reviewing which documents, dynamic watermarks for privilege tracking, and NDA gates that require signed acceptance before any viewing — the exact controls M&A counsel expect at a price that doesn't force the seller to pay $15K+ for Datasite.
I'm a PE partner at a mid-market fund — how should I think about platform versus add-on deal pacing in 2026?
Mid-market PE in 2026 is biased heavily toward add-ons over platforms — partly because interest rates have repriced debt economics, partly because IC committees are more skeptical of new platforms after the 2022-2023 mark-down cycle. McKinsey's 2024 Americas data showed PE share of M&A volume at $398B (22%), down from $865B (28%) at the 2021 peak but still structurally significant. For your fund running 4-6 portfolio companies at any given time, the practical playbook is: aggressive add-on sourcing in your existing verticals (where you already have IC conviction), platform deals only in sectors with differentiated thesis and management teams you've pattern-matched, and intentional portfolio rotation (selling into strategic bids while they're hungry in TMT and renewables). Your diligence bottleneck at scale is data room quality across concurrent deals. Peony Data Room at $52/admin/month handles multiple concurrent PE data rooms with per-deal access controls, AI auto-indexing for each target's 500-1500 documents, and page-level analytics so your deal team sees which IC members have actually reviewed which targets before committee meetings.
I'm a sell-side investment banker pitching a $200M-$400M enterprise-value tech deal — what 2026 data points should I include in my market positioning for the seller?
For a $200M-$400M tech sell-side mandate in 2026, the most credible market positioning data points are: global M&A reached approximately $2.6 trillion by August 2025 (strongest first 7 months since 2021 despite 16% lower deal count), TMT was the leading sector through first 9 months of 2025 at $536B, average deal size rose approximately 4% in 2024 to $443M (favoring higher-quality mid-market assets over volume), and North America accounted for approximately 62% of global M&A in first 9 months of 2025 (concentration helps US sellers). Frame the seller's thesis around quality-over-quantity, scarcity value (fewer, better deals closing), and strategic-premium differentiation versus a PE auction. The data room you put in front of buyers will shape the perceived quality of the asset: a Peony M&A data room at $52/admin/month with AI auto-indexing, dynamic watermarks, page-level analytics, and Smart Q&A signals professionalism to strategic buyers in a way that a Box or Dropbox shared folder actively works against your narrative — buyers read 'generic cloud drive' as 'first-time seller, inexperienced.'
Is the claim that 'most M&A deals fail' actually still true in 2026, or has the research been updated?
The short answer: the traditional 70-90% 'deal failure' number is both true and misleading, and recent research gives a more nuanced picture you can actually use. A 2024 analysis of 40,000 deals over 40 years concluded that approximately 70-75% of acquisitions fail to meet their originally-stated objectives (synergy targets, integration milestones, accretion goals) — that's the scary number. But separate Bain/Harding work cited in 2025 shows that approximately 70% of mergers now succeed when measured over longer horizons with better integration discipline among repeat acquirers. Translation: the average single-deal acquirer still fails most of the time, but the best serial acquirers (companies that have built an M&A playbook, M&A integration function, and cultural alignment process) now bend the odds in their favor. For a corp dev team at a first-time acquirer, the failure risk is real and you should pad your synergy assumptions by 30-40%. For a serial acquirer with an integration team that has run 20+ deals, the recent success rate is much closer to 70%. The single highest-leverage tool in beating the average: rigorous diligence and post-close tracking, both of which live in the data room.
How did private equity's share of global M&A change over the last decade, and what does it mean for operators considering a PE buyer versus a strategic?
Over the past decade, private equity has gone from 'important' to 'structural.' Recent analysis suggests PE-sponsored buyouts account for nearly 35% of global M&A by deal count this decade, up from roughly 20% a decade earlier. In the Americas specifically, McKinsey reports PE's share of M&A volume at $398B (22%) in 2024, down from $865B (28%) in 2021 but still massive in absolute terms — and the dry powder sitting at PE funds globally exceeds $2 trillion, which effectively sets a floor under certain valuations. For an operator choosing between a strategic buyer and a PE sponsor in 2026, the practical trade-offs are clear: strategics typically pay higher multiples for real synergy logic, want full control, and often restructure within 12 months; PE sponsors typically pay competitive multiples, offer rollover equity with a clear second bite of the apple, and give you more operational autonomy in year 1-2. Neither is universally better — it depends on your personal optionality, tax situation, and how strongly you feel about control. Peony serves both sides: M&A solution for strategic sell-sides, private equity solution for sponsor-side diligence, family offices solution for HNW LP reporting.
What should I actually do differently in 2026 versus 2021 if I'm running a corp dev or PE function?
Five concrete differences I'd embed in a 2026 playbook versus a 2021 playbook. First: expect 2-3x longer diligence timelines and budget for it — the average 2021 deal closed on momentum, the average 2026 deal closes on rigor. Second: assume sellers' financials are higher quality than 2021 (audited, recognized revenue is cleaner) but business fundamentals are more scrutinized (growth durability, CAC efficiency, net retention). Third: regulatory risk is structurally higher — HSR thresholds lowered in 2024, CFIUS scrutiny on cross-border tech is tighter, state privacy laws create exposure that didn't exist at scale three years ago. Fourth: integration planning starts in diligence, not at close — the corp dev teams that win now bring integration leads into week 2 of LOI, not week 12. Fifth: data room quality signals seller professionalism in a way it didn't when cheap money covered operational sins. For PE partners at mid-market funds, the winning strategy is fewer platform deals, more aggressive add-ons, disciplined portfolio rotation. Use a Peony M&A data room at $52/admin/month with AI auto-indexing and page-level analytics to signal professionalism and accelerate diligence throughput — both matter more in 2026 than in 2021.
The short version
Ten facts. 2021 was the peak, not the baseline. 2023 was the trough. 2024-2026 is selective — fewer, larger, more deliberate deals. PE is structural (35% of global M&A count). North America is concentrated (62% of 2025 volume). Tech, AI, renewables lead. SPAC era is over. Average acquirer fails; serial acquirers succeed. M&A's share of GDP is historically lower than the peaks.
For your deal in 2026, the implication is simple: professionalism wins. The sellers, buyers, attorneys, and advisors who run tight processes with professional data rooms close faster, at better multiples, with fewer derailers. The ones who send Google Drive links signal amateur hour and invite the outcome that implies.
Good hunting.